Fig. 8.
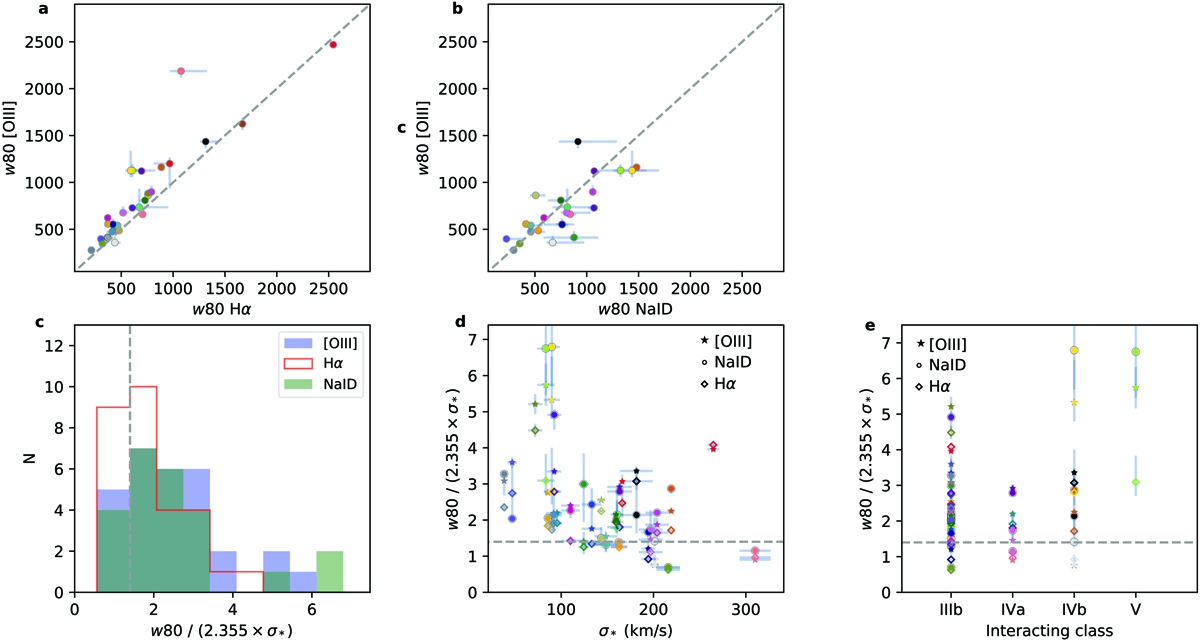
Panels a and b: w80 velocity-velocity diagram for [O III] vs. Hα (a), and [O III] vs. Na ID (b). Each nucleus is identified with a distinct colour (see labels in Fig. 6). Dashed lines display the 1:1 relation. Panel c: distributions of η = w80/(2.355 × σ*) for the three kinematic tracers, as labelled in the legend; the dashed vertical line marks the position η = 1.4 (see text). Panel d: [O III] (stars), Hα (diamonds), and Na ID (circles) η measurements as a function of σ*. None of the velocity dispersions and w80 measurements are corrected for instrumental broadening; this correction would affect the only two σ* measurements close to the MUSE spectral resolution (∼50 km s−1), associated with the 20100−4156 N and F22491−1808 W nuclei, further increasing their η values. Panel e: [O III] (stars), Hα (diamonds), and Na ID (circles) η measurements as a function of the IC. The dashed horizontal line in panels d and e marks the position η = 1.4.
Current usage metrics show cumulative count of Article Views (full-text article views including HTML views, PDF and ePub downloads, according to the available data) and Abstracts Views on Vision4Press platform.
Data correspond to usage on the plateform after 2015. The current usage metrics is available 48-96 hours after online publication and is updated daily on week days.
Initial download of the metrics may take a while.