Fig. 7.
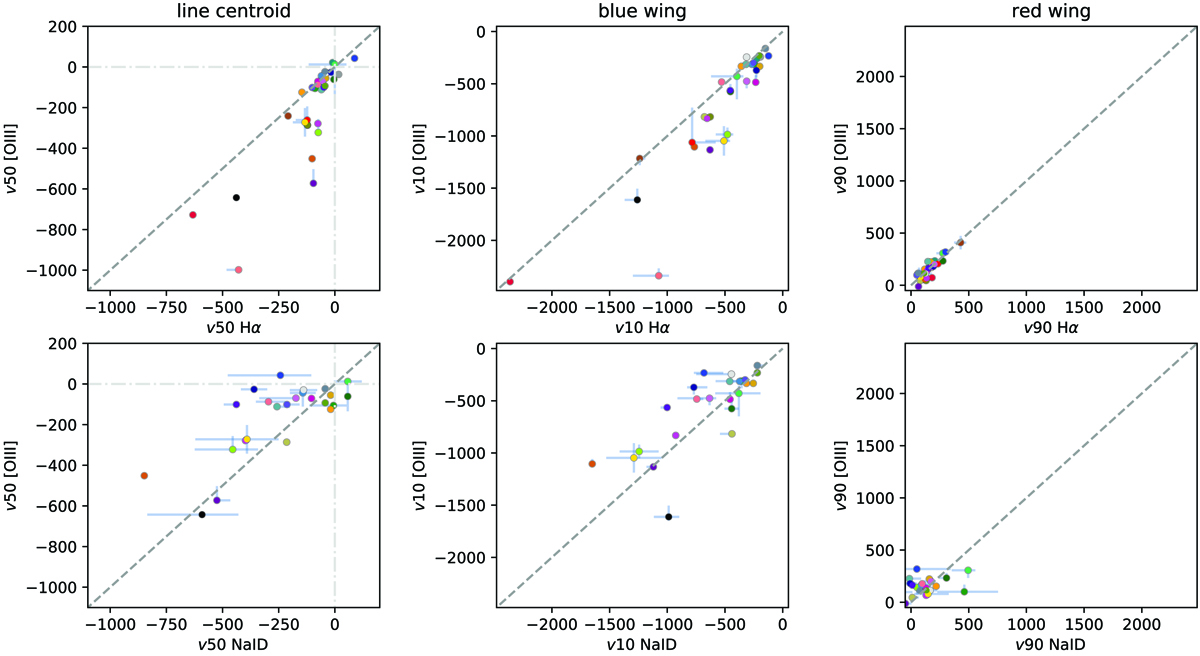
Velocity-velocity diagram used to compare the non-parametric velocities of [O III], Hα, and Na ID gas for the 31 nuclei reported in Table 4. Each nucleus is identified with a distinct colour (see labels in Fig. 6). In the left column, we show the central velocities of [O III] vs. Hα (top) and of [O III] vs. Na ID (bottom); horizontal and vertical dot-dashed lines mark the zero-velocity positions, and the dashed line displays the 1:1 relation. In the central column, we show the v10 velocities, associated with the blue wings of [O III] and Hα (top), and of [O III] and Na ID (bottom); the dashed line indicates the 1:1 relation. In the right column, we show the v90 velocities, associated with the red wings of [O III] and Hα (top) and of [O III] and Na ID (bottom); the dashed line indicates the 1:1 relation.
Current usage metrics show cumulative count of Article Views (full-text article views including HTML views, PDF and ePub downloads, according to the available data) and Abstracts Views on Vision4Press platform.
Data correspond to usage on the plateform after 2015. The current usage metrics is available 48-96 hours after online publication and is updated daily on week days.
Initial download of the metrics may take a while.