Free Access
Fig. 6.
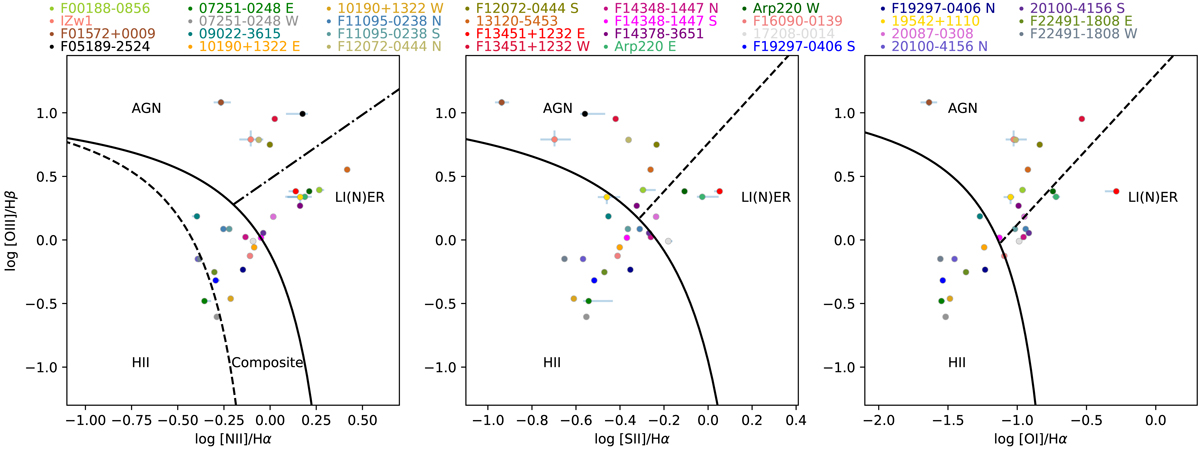
Standard diagnostic BPT diagrams showing our flux ratio measurements obtained from the ULIRG nuclear spectra. Each nucleus is identified with a distinct colour, as labelled. Black curves separate HII-, composite-, AGN- and LI(N)ER-like line ratios, as labelled in the three panels (see text for details).
Current usage metrics show cumulative count of Article Views (full-text article views including HTML views, PDF and ePub downloads, according to the available data) and Abstracts Views on Vision4Press platform.
Data correspond to usage on the plateform after 2015. The current usage metrics is available 48-96 hours after online publication and is updated daily on week days.
Initial download of the metrics may take a while.