Fig. 2.
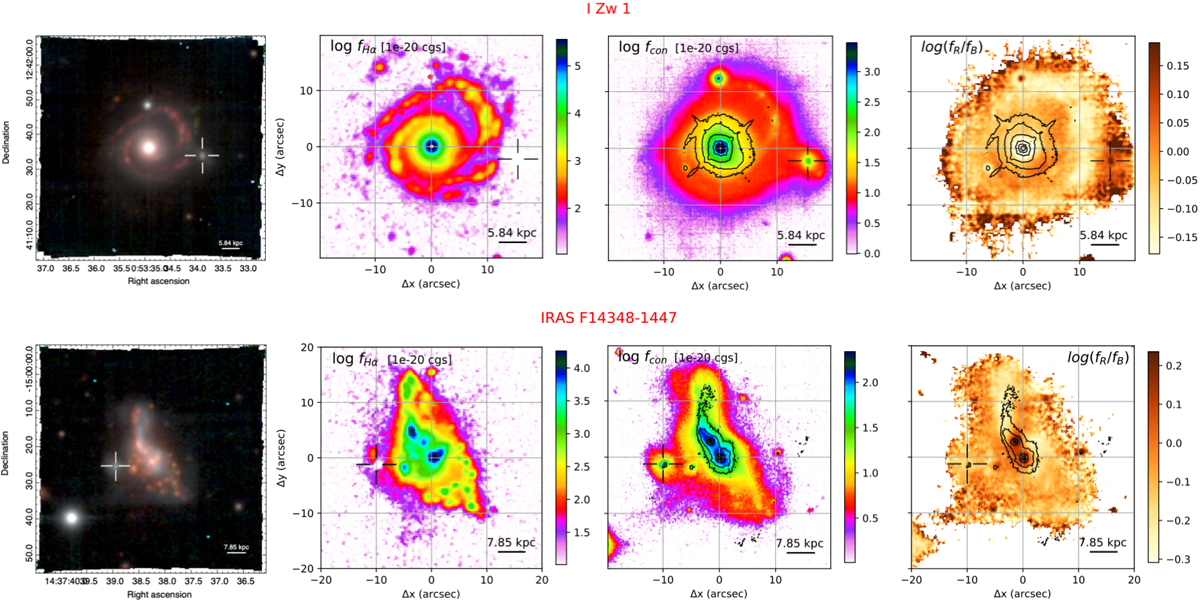
IZw1 (top) and F14348−1447 (bottom) MUSE images. Left column: colour-composite optical image, showing [O III] (green), Hα (red), and continuum emission (blue). Second column: Hα map obtained by collapsing the MUSE data cube on the emission line after subtracting the continuum using adjacent regions at shorter and longer wavelengths. Third column: red continuum (∼ 8500 Å) image from MUSE, with contours from HST/F160W. Right column: continuum colour map obtained from MUSE by dividing the red continuum image (∼ 8500 Å) by the blue image (∼ 4500 Å); contours from HST/F160W. See Appendix C for further details. The crosses in the panels show the detected satellites in the MUSE FOV.
Current usage metrics show cumulative count of Article Views (full-text article views including HTML views, PDF and ePub downloads, according to the available data) and Abstracts Views on Vision4Press platform.
Data correspond to usage on the plateform after 2015. The current usage metrics is available 48-96 hours after online publication and is updated daily on week days.
Initial download of the metrics may take a while.