Fig. C.8.
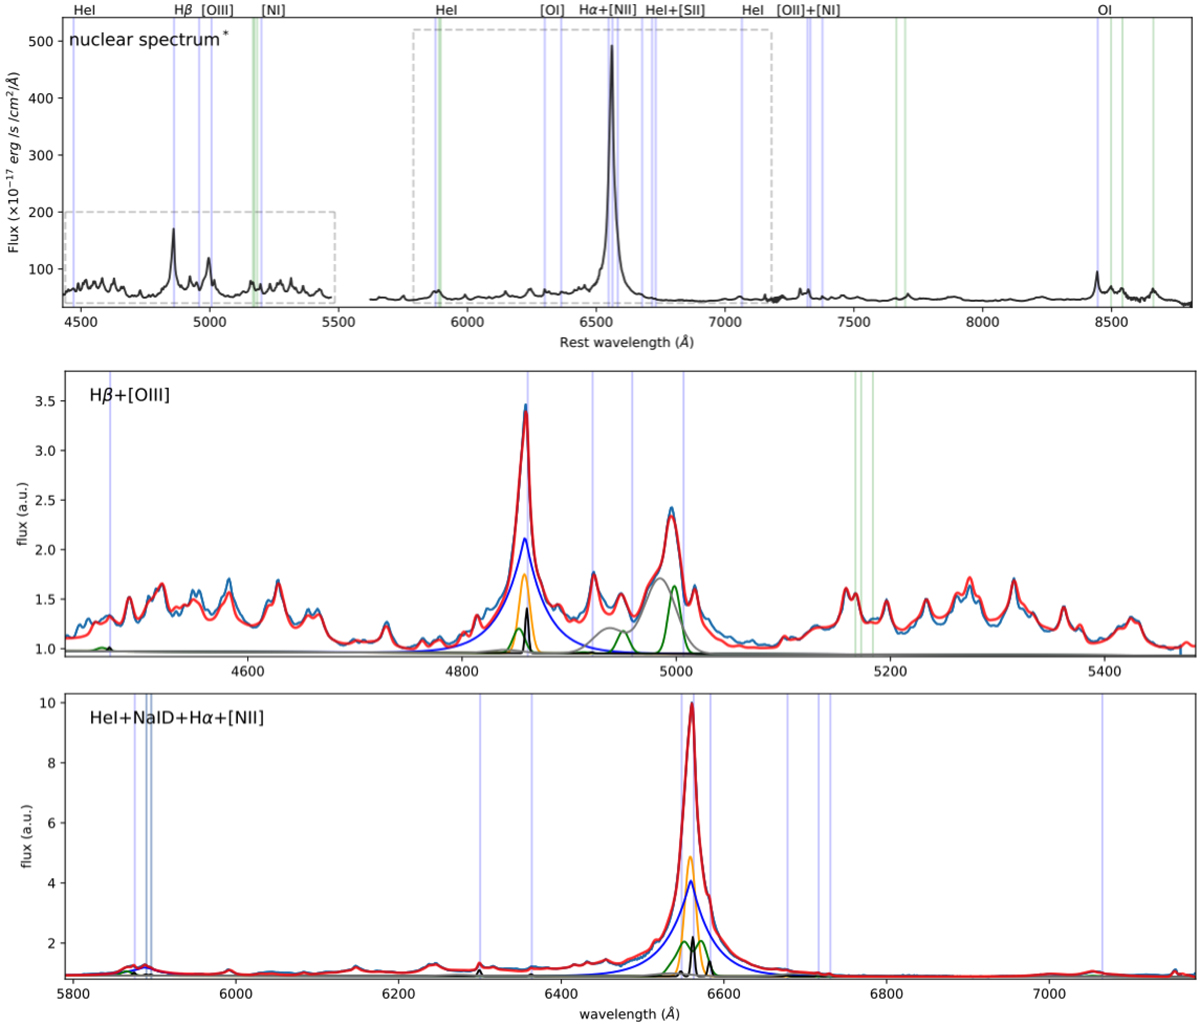
Top: IZw1 nuclear spectrum (black curve) extracted from a circular aperture r < 0.4″ but excluding the central pixel (where Hα is saturated). The blue vertical lines mark the wavelengths of the emission lines detected in the spectrum; the green lines mark the position of stellar absorption systems (i.e. from left to right: MgI triplet, Na ID and KI doublets, CaII triplet). The latter transitions in absorption are not detected because of the strong AGN continuum and emission lines. The portions of the spectra around 5500 Å are missing because a filter blocked the laser contamination; the portions in the two boxes are reported in the central and bottom panels with the best-fit curves. Centre: normalised nuclear spectrum in the vicinity of the Hβ+[O III] complex (blue curve), with total best-fit model (red). Individual kinematic components are shown with different colours: black, green, and grey Gaussians represent systemic and outflow components; blue and orange curves are used to model the BLR Balmer emission; and iron components are not reported. Bottom: normalised nuclear spectrum in the vicinity of the HeI+Na ID and Hα+NII complexes (blue curve), with superimposed best-fit model (red curve). Different kinematic components required to reproduce the spectrum are shown as in the central panel.
Current usage metrics show cumulative count of Article Views (full-text article views including HTML views, PDF and ePub downloads, according to the available data) and Abstracts Views on Vision4Press platform.
Data correspond to usage on the plateform after 2015. The current usage metrics is available 48-96 hours after online publication and is updated daily on week days.
Initial download of the metrics may take a while.