Fig. C.4.
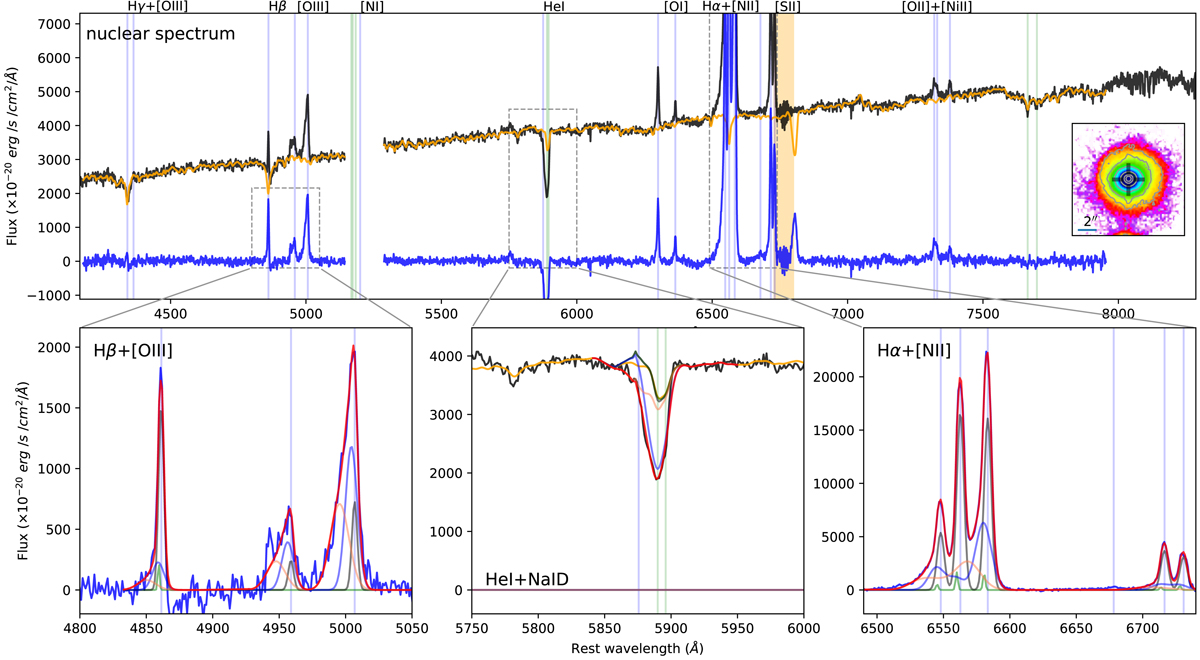
Top panel: IRAS F00188-0856 nuclear spectrum (black curve), extracted from a circular aperture with r < 0.4″. The corresponding pPXF best-fit model profile is shown in orange. The continuum-subtracted spectrum (blue curve) is obtained by subtracting the best-fit pPXF model from the original spectrum. The vertical blue lines mark the wavelengths of the emission lines detected in the spectrum; the vertical green lines mark the position of stellar absorption systems (i.e. from left to right: MgI triplet, Na ID and KI doublets). The regions excluded from the pPXF fit and corresponding to the most intense sky line residuals are highlighted as orange shaded areas; the portions of the spectra around 5300 Å are missing because a filter blocked the laser contamination. The inset in the top panel shows the red stellar continuum emission map in the vicinity of the nuclear regions, with HST/F160W contours as in Fig. C.1; the nuclear position is shown with a black marker. Bottom insets: multi-component best-fit analysis results for the main emission (Hβ and [O III], left; Hα, [N II] and [S II], right) and absorption (Na ID, centre) line features. Na ID multi-component best-fit curves are superimposed on the observed spectrum (black curve); emission components are not required to reproduce the total profile of Na ID.
Current usage metrics show cumulative count of Article Views (full-text article views including HTML views, PDF and ePub downloads, according to the available data) and Abstracts Views on Vision4Press platform.
Data correspond to usage on the plateform after 2015. The current usage metrics is available 48-96 hours after online publication and is updated daily on week days.
Initial download of the metrics may take a while.