Fig. C.1.
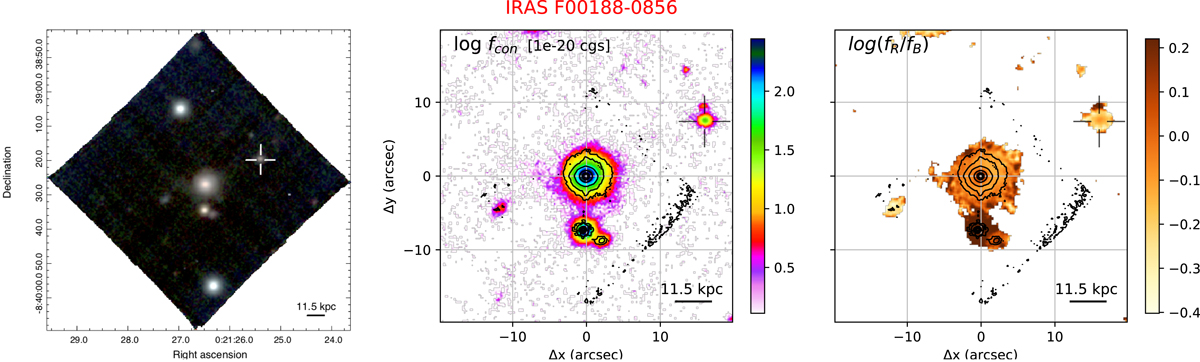
IRAS F00188−0856 images from MUSE observations with TOT = 0.68 h. Left: colour-composite optical image, showing [O III] (green, from the wavelength range 4990 − 5015 Å rest-frame), Hα (red, 6555 − 6574 Å), and stellar continuum (blue, 4400 − 4500 Å). Centre: red (7930 − 7530 Å) continuum image, with contours from HST/F160W. Right: continuum colour map obtained from MUSE by dividing the red continuum image (in the central panel) by a blue image obtained by collapsing the stellar emission in the range 4400 − 4500 Å; contours from HST/F160W. In all panels, we display the IRAS F00188−0856 companion with a cross.
Current usage metrics show cumulative count of Article Views (full-text article views including HTML views, PDF and ePub downloads, according to the available data) and Abstracts Views on Vision4Press platform.
Data correspond to usage on the plateform after 2015. The current usage metrics is available 48-96 hours after online publication and is updated daily on week days.
Initial download of the metrics may take a while.