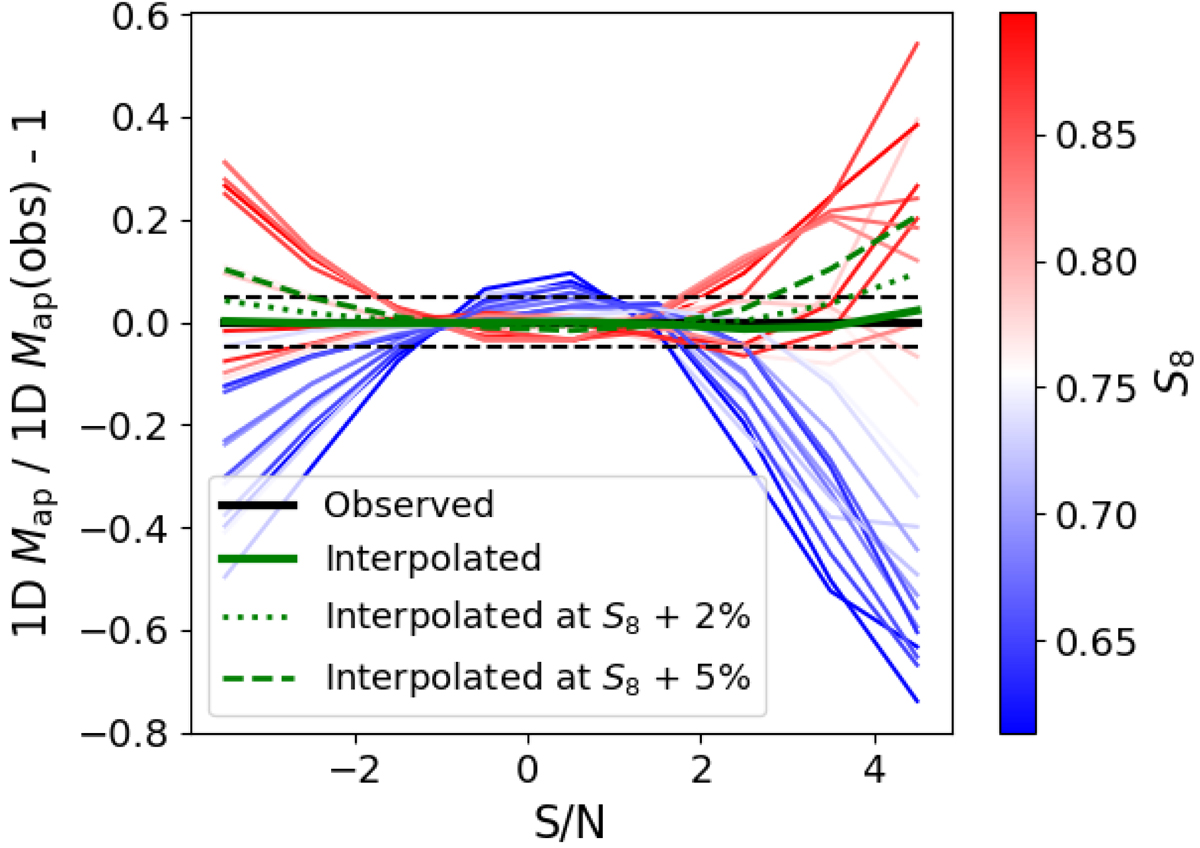
Fig. 7.

Testing the emulation of 1D Map. The solid green curve corresponds to the relative excess of the interpolated DV with respect to the measured DV. This error on the interpolation remains below 5% (dashed black lines) and small in comparison to the relative excess interpolated for a variation of 2% (doted green curve) and 5% (dashed green curve) of S8, and to the 25 DVs used to build the emulator (blue to red curves).
Current usage metrics show cumulative count of Article Views (full-text article views including HTML views, PDF and ePub downloads, according to the available data) and Abstracts Views on Vision4Press platform.
Data correspond to usage on the plateform after 2015. The current usage metrics is available 48-96 hours after online publication and is updated daily on week days.
Initial download of the metrics may take a while.


