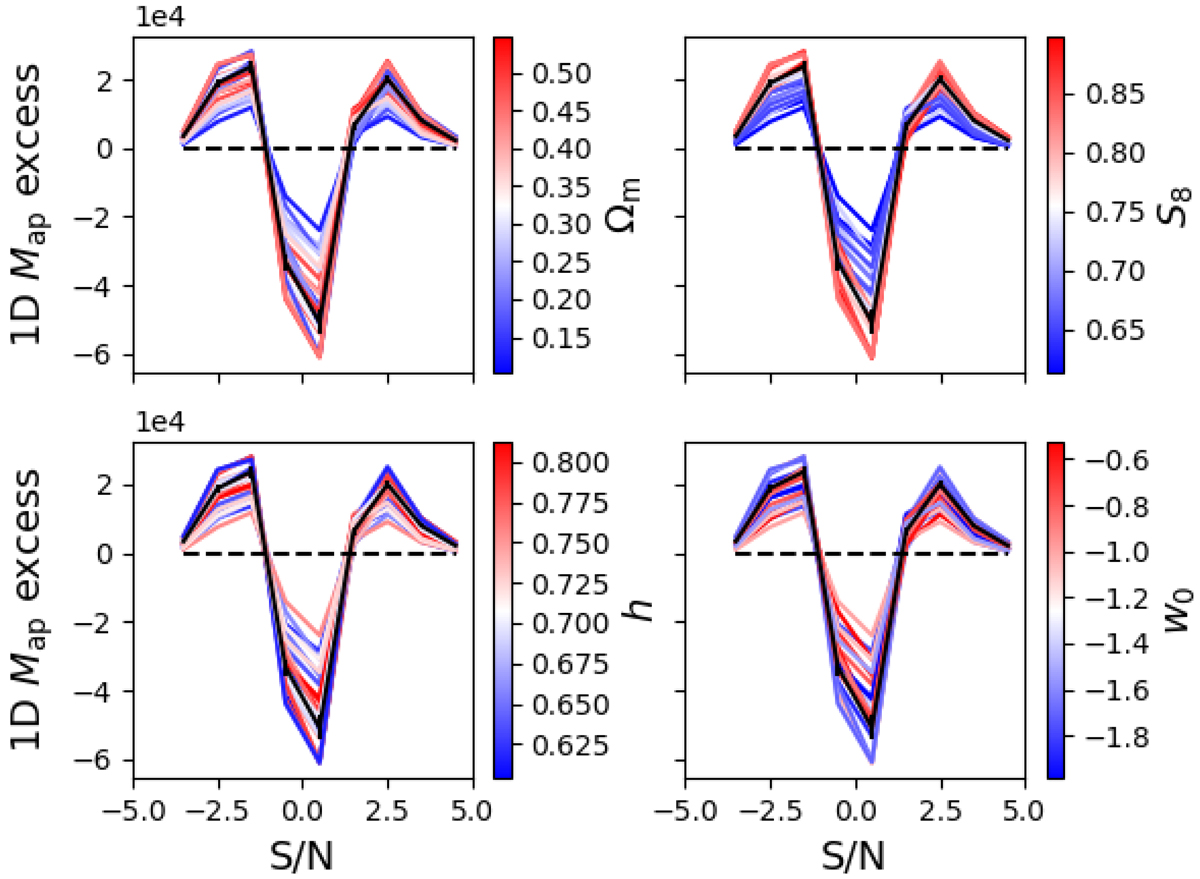
Fig. 3.

Variation of the excess number of Map pixels over noise with cosmology. The black curve corresponds to the excess 1D Map in the observation mock, with error bars from the diagonal of the covariance matrix. Color-coded are variations in Ωm (top left), S8 (top right), h (bottom left), and w0 (bottom right). A smooth color gradient indicates a correlation between the data vector and the probed cosmological parameter. No tomography has been performed here.
Current usage metrics show cumulative count of Article Views (full-text article views including HTML views, PDF and ePub downloads, according to the available data) and Abstracts Views on Vision4Press platform.
Data correspond to usage on the plateform after 2015. The current usage metrics is available 48-96 hours after online publication and is updated daily on week days.
Initial download of the metrics may take a while.


