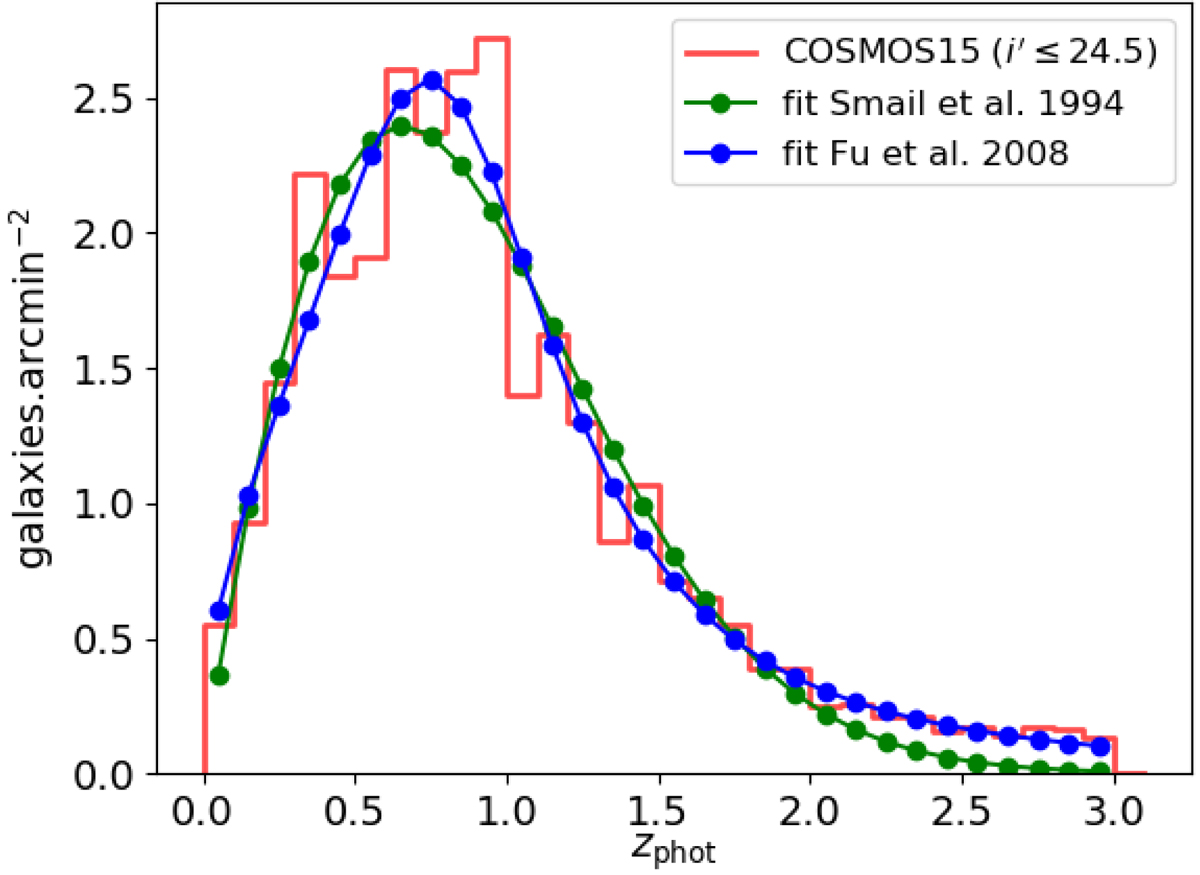
Fig. 1.

Redshift distribution normalized to 30 gal.arcmin−2. The red histogram corresponds to the COSMOS2015 photometric redshift distribution after a cut at i′≤24.5, the green curve to the fit of a Smail et al. (1994) function to the COSMOS2015 histogram, and the blue curve to a Fu et al. (2008) fit. In this paper we use the Fu et al. (2008) fit that captures the high-redshift tail in contrast to the other function.
Current usage metrics show cumulative count of Article Views (full-text article views including HTML views, PDF and ePub downloads, according to the available data) and Abstracts Views on Vision4Press platform.
Data correspond to usage on the plateform after 2015. The current usage metrics is available 48-96 hours after online publication and is updated daily on week days.
Initial download of the metrics may take a while.


