Fig. 7.
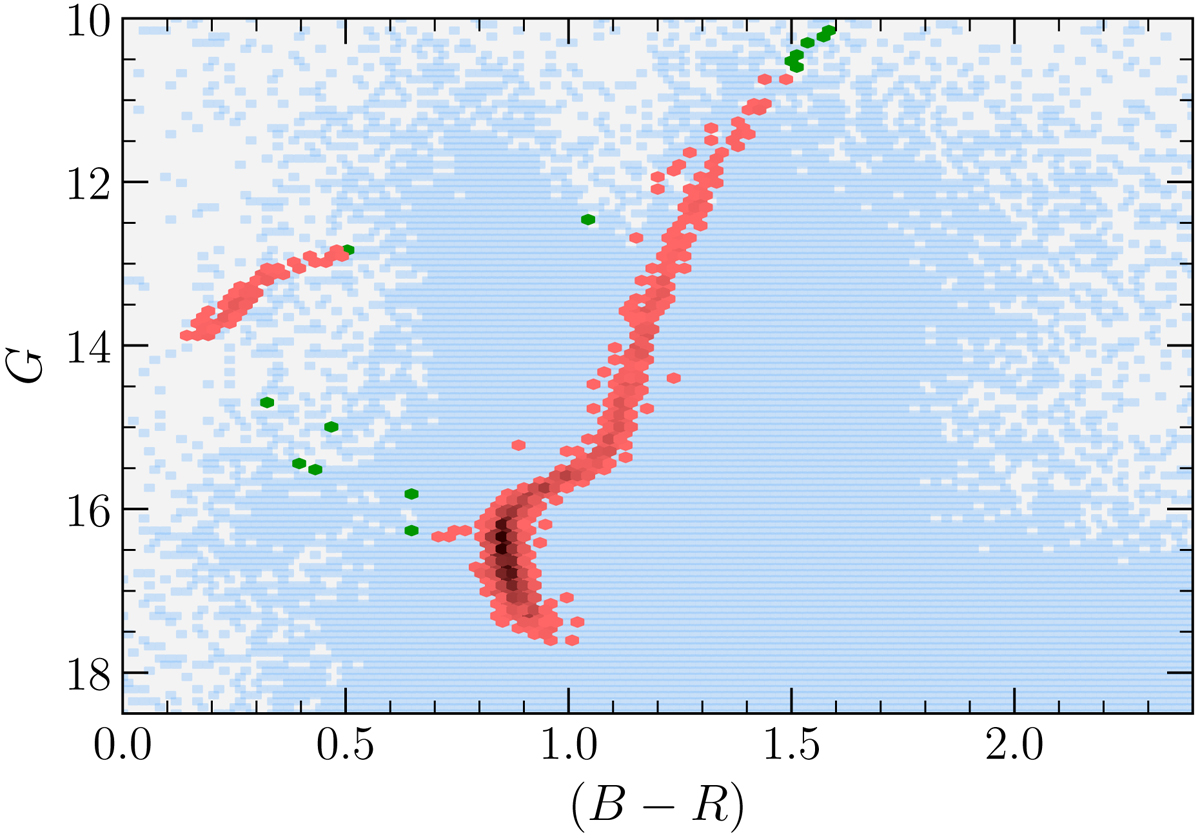
Color magnitude diagram (CMD) of NGC 6397 Gaia DR2 data, after different filtering steps. The blue points indicate the stars that failed the PM error, astrometric and photometric flags, maximum projected radius and PM filters. The green points the stars that passed these 3 filters but are offset from the CMD. The red points show the Gaia sample of stars after the previous filters and subsequent CMD filtering, color-coded from red to dark red, according to increasing star counts.
Current usage metrics show cumulative count of Article Views (full-text article views including HTML views, PDF and ePub downloads, according to the available data) and Abstracts Views on Vision4Press platform.
Data correspond to usage on the plateform after 2015. The current usage metrics is available 48-96 hours after online publication and is updated daily on week days.
Initial download of the metrics may take a while.