Open Access
Fig. 5.
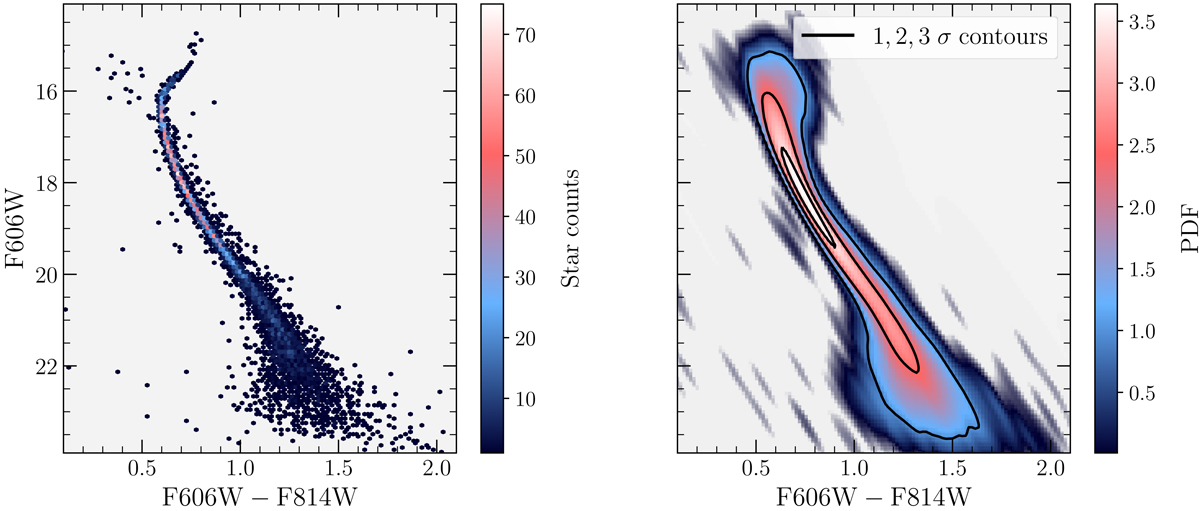
HST color-magnitude diagrams. Left: CMD after the PM filtering process explained in Sect. 5.1.1. Right: Kernel density estimation of the HST isochrone displayed in the left panel. The 1, 2 and 3σ contours are displayed (from in to out).
Current usage metrics show cumulative count of Article Views (full-text article views including HTML views, PDF and ePub downloads, according to the available data) and Abstracts Views on Vision4Press platform.
Data correspond to usage on the plateform after 2015. The current usage metrics is available 48-96 hours after online publication and is updated daily on week days.
Initial download of the metrics may take a while.