Fig. 3.
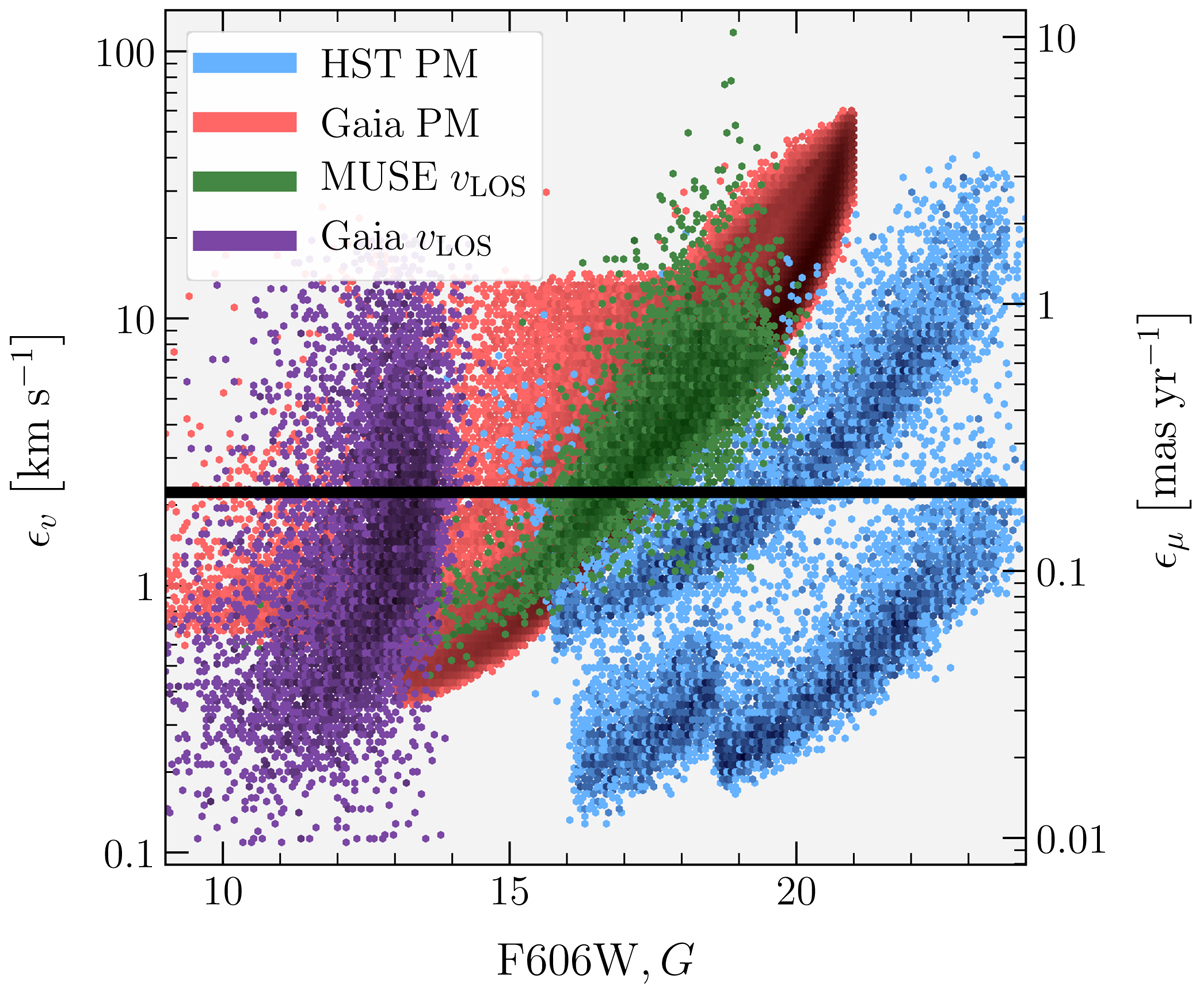
Proper motion errors and LOS velocity errors (converted to PM errors for distance of 2.39 kpc) for the different datasets. The horizontal line displays ϵμ = 0.197 mas yr−1. The three different blue zones correspond to different baselines in the HST PM data. We note that magnitudes G and F606W are close to equivalent (they match to ±0.1).
Current usage metrics show cumulative count of Article Views (full-text article views including HTML views, PDF and ePub downloads, according to the available data) and Abstracts Views on Vision4Press platform.
Data correspond to usage on the plateform after 2015. The current usage metrics is available 48-96 hours after online publication and is updated daily on week days.
Initial download of the metrics may take a while.