Fig. B.1.
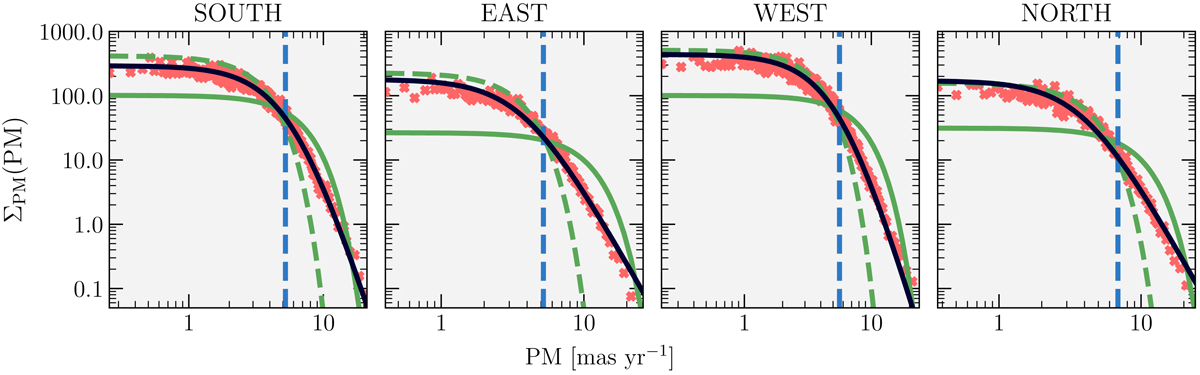
Surface density of proper motion moduli (defined in Eq. (19)) for the four 5° distant regions around NGC 6397 (for simplicity, we call them SOUTH, EAST, WEST and NORTH), represented by red crosses. Solid green curves display the best MLE fit for a Gaussian distribution, while dashed green curves display the best Gaussian MLE fit when only considering the regions with proper motions inside the limit of the dashed blue vertical line. The best MLE fit using Eq. (18) is displayed as the black curves.
Current usage metrics show cumulative count of Article Views (full-text article views including HTML views, PDF and ePub downloads, according to the available data) and Abstracts Views on Vision4Press platform.
Data correspond to usage on the plateform after 2015. The current usage metrics is available 48-96 hours after online publication and is updated daily on week days.
Initial download of the metrics may take a while.