Open Access
Fig. 17.
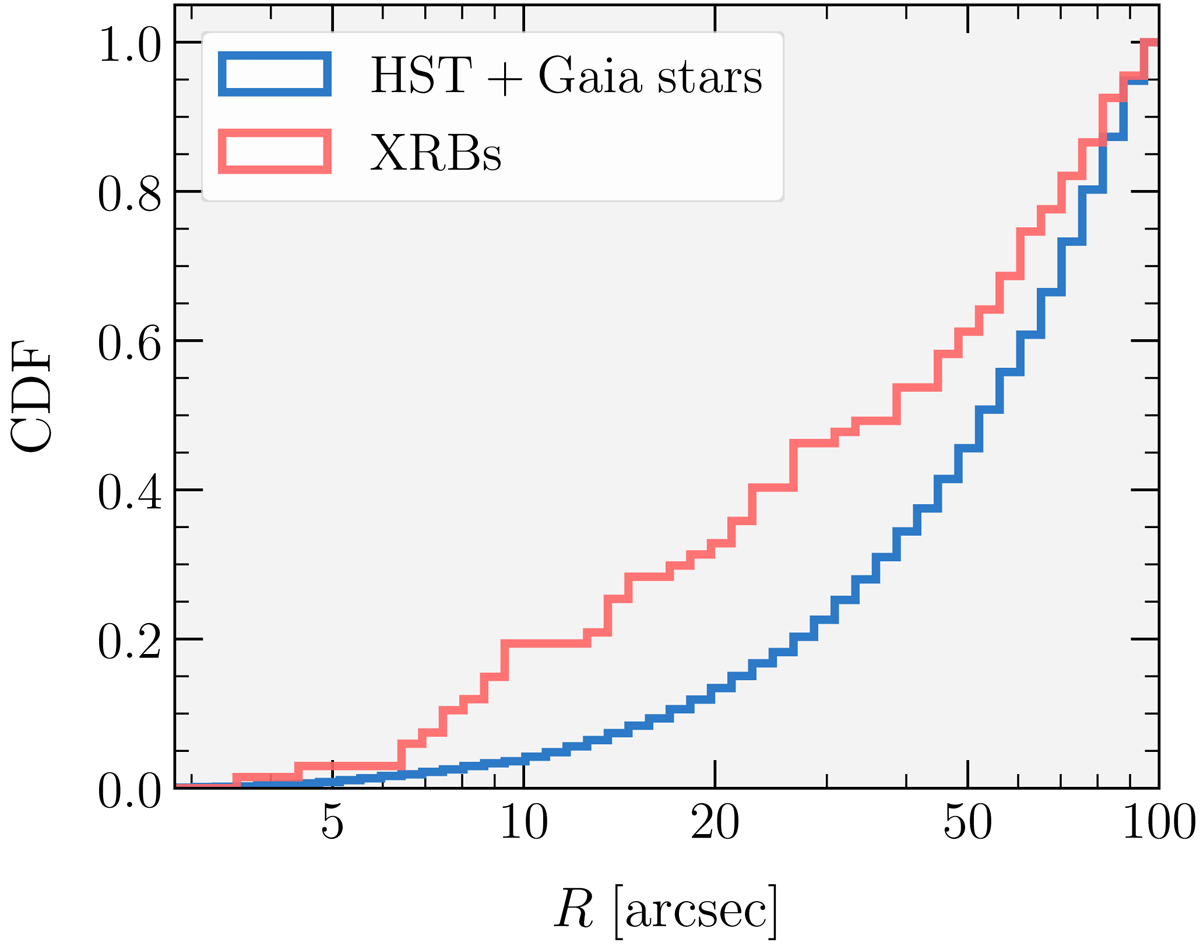
Cumulative distribution functions of projected radii for our HST+Gaia subset in blue and for the X-ray binaries from Bahramian et al. (2020) in red. We considered the subsets in the range of 2.7″ < Rproj < 100″, where the HST sample seemed complete, according to Fig. 8.
Current usage metrics show cumulative count of Article Views (full-text article views including HTML views, PDF and ePub downloads, according to the available data) and Abstracts Views on Vision4Press platform.
Data correspond to usage on the plateform after 2015. The current usage metrics is available 48-96 hours after online publication and is updated daily on week days.
Initial download of the metrics may take a while.