Open Access
Fig. 13.
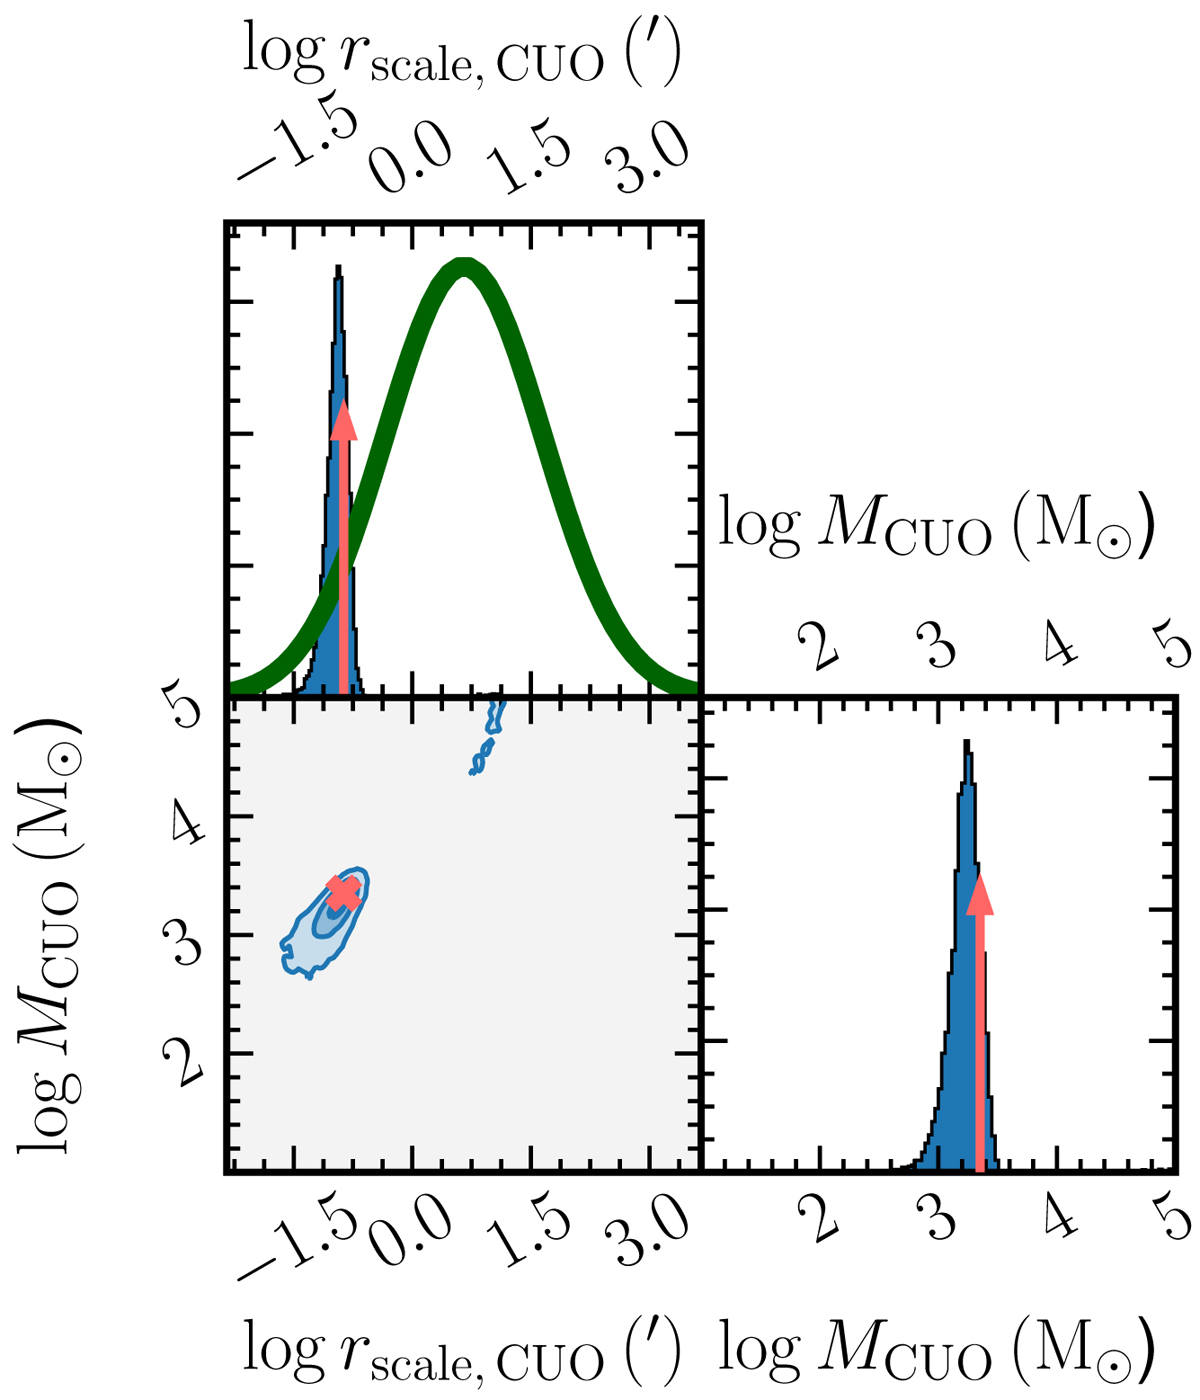
Selected marginal distributions of the CUO effective radius and mass, and their covariance, for a preliminary MAMPOSST-PM run for an isotropic, single-population plus Plummer CUO SD profile, similar to model 10, but with a prior on the log CUO scale radius centered at ![]() . The notation is the same as in Fig. 12.
. The notation is the same as in Fig. 12.
Current usage metrics show cumulative count of Article Views (full-text article views including HTML views, PDF and ePub downloads, according to the available data) and Abstracts Views on Vision4Press platform.
Data correspond to usage on the plateform after 2015. The current usage metrics is available 48-96 hours after online publication and is updated daily on week days.
Initial download of the metrics may take a while.