Fig. 9
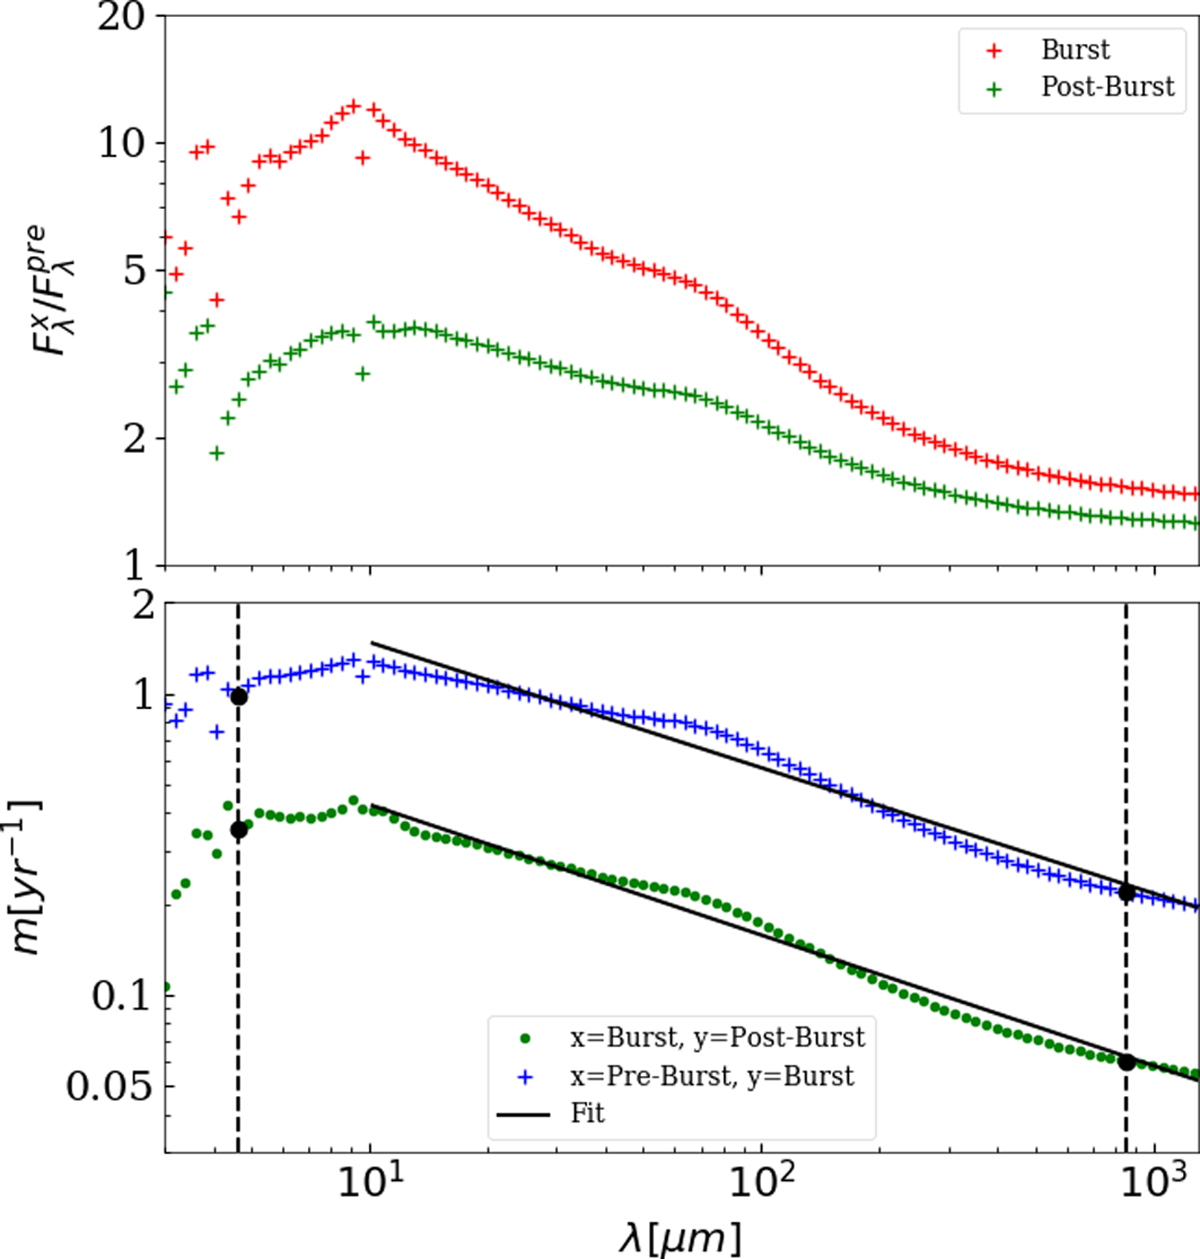
Top: wavelength dependence of the relative flux increase for the burst (red) and post-burst (green) epochs for mean model. Markers denote grid points. Bottom: wavelength dependence of the speed of the relative flux change m for the pre-burst to burst (blue) and burst to post-burst (green) periods. The black solid lines mark linear fits to λ > 10 μm, the dashed vertical lines indicates the wavelengths used by Contreras Peña et al. (2020). The black dots mark the values for m used to compare our models to Contreras Peña et al. (2020).
Current usage metrics show cumulative count of Article Views (full-text article views including HTML views, PDF and ePub downloads, according to the available data) and Abstracts Views on Vision4Press platform.
Data correspond to usage on the plateform after 2015. The current usage metrics is available 48-96 hours after online publication and is updated daily on week days.
Initial download of the metrics may take a while.