Fig. 8
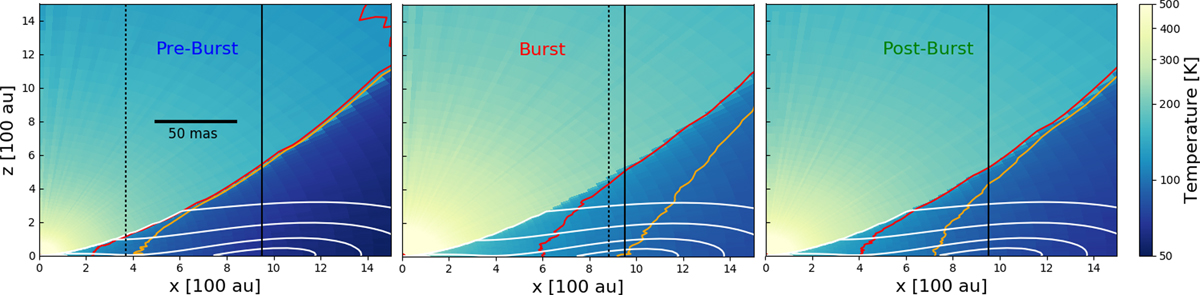
Temperature distribution of the mean model in the x-z plane (innermost part of first quadrant) for the pre-burst (left), burst- (center) and post-burst epochs (right). The orange and red lines enclose the temperature range from 94 K (orange) to 120 K (red) during the pre- and burst epochs, respectively. The white contours mark gas particle volume densities of
![]() which decrease with increasing z. The vertical solid black line indicates the outer radius of the disk. The dashed black lines mark the radius of the maser ring from the first and 4th epoch of the VLBI observations (Burns et al. 2020, and in prep.). The length of the black bar corresponds to 50 mas.
which decrease with increasing z. The vertical solid black line indicates the outer radius of the disk. The dashed black lines mark the radius of the maser ring from the first and 4th epoch of the VLBI observations (Burns et al. 2020, and in prep.). The length of the black bar corresponds to 50 mas.
Current usage metrics show cumulative count of Article Views (full-text article views including HTML views, PDF and ePub downloads, according to the available data) and Abstracts Views on Vision4Press platform.
Data correspond to usage on the plateform after 2015. The current usage metrics is available 48-96 hours after online publication and is updated daily on week days.
Initial download of the metrics may take a while.