Fig. 5
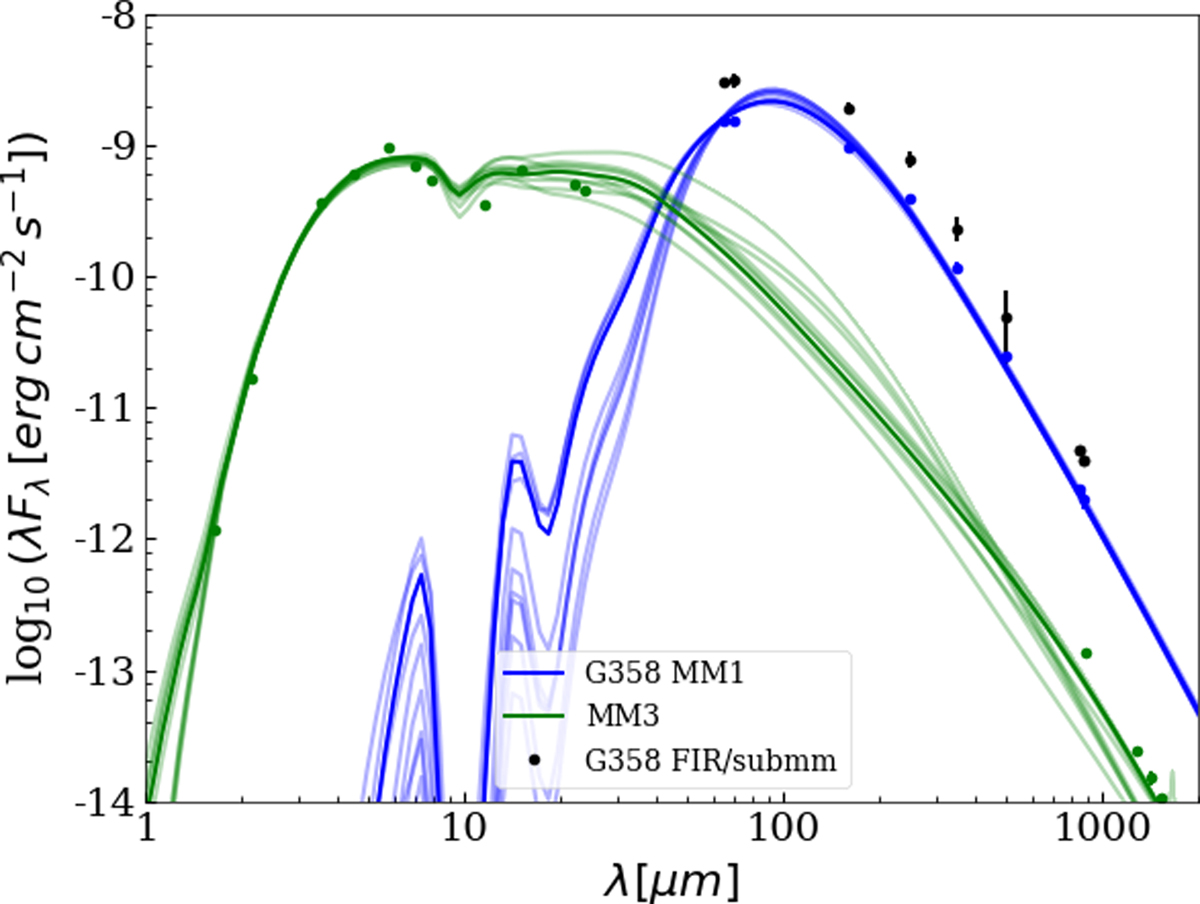
Pre-burst SEDs for the following sources: black symbols – total FIR/(sub)mm emission of G358, green – MM3, blue – MM1, derived from the total FIR/(sub)mm emission by removing contributions from all other sources (including MM3). For MM1 and MM3, the observed values are shown together with the ten best RT fits. At wavelengths beyond 40 μm MM1 dominates the total flux density. The seemingly gap at 10 μm in the MM1 SED is due to strong silicate absorption.
Current usage metrics show cumulative count of Article Views (full-text article views including HTML views, PDF and ePub downloads, according to the available data) and Abstracts Views on Vision4Press platform.
Data correspond to usage on the plateform after 2015. The current usage metrics is available 48-96 hours after online publication and is updated daily on week days.
Initial download of the metrics may take a while.