Fig. 4
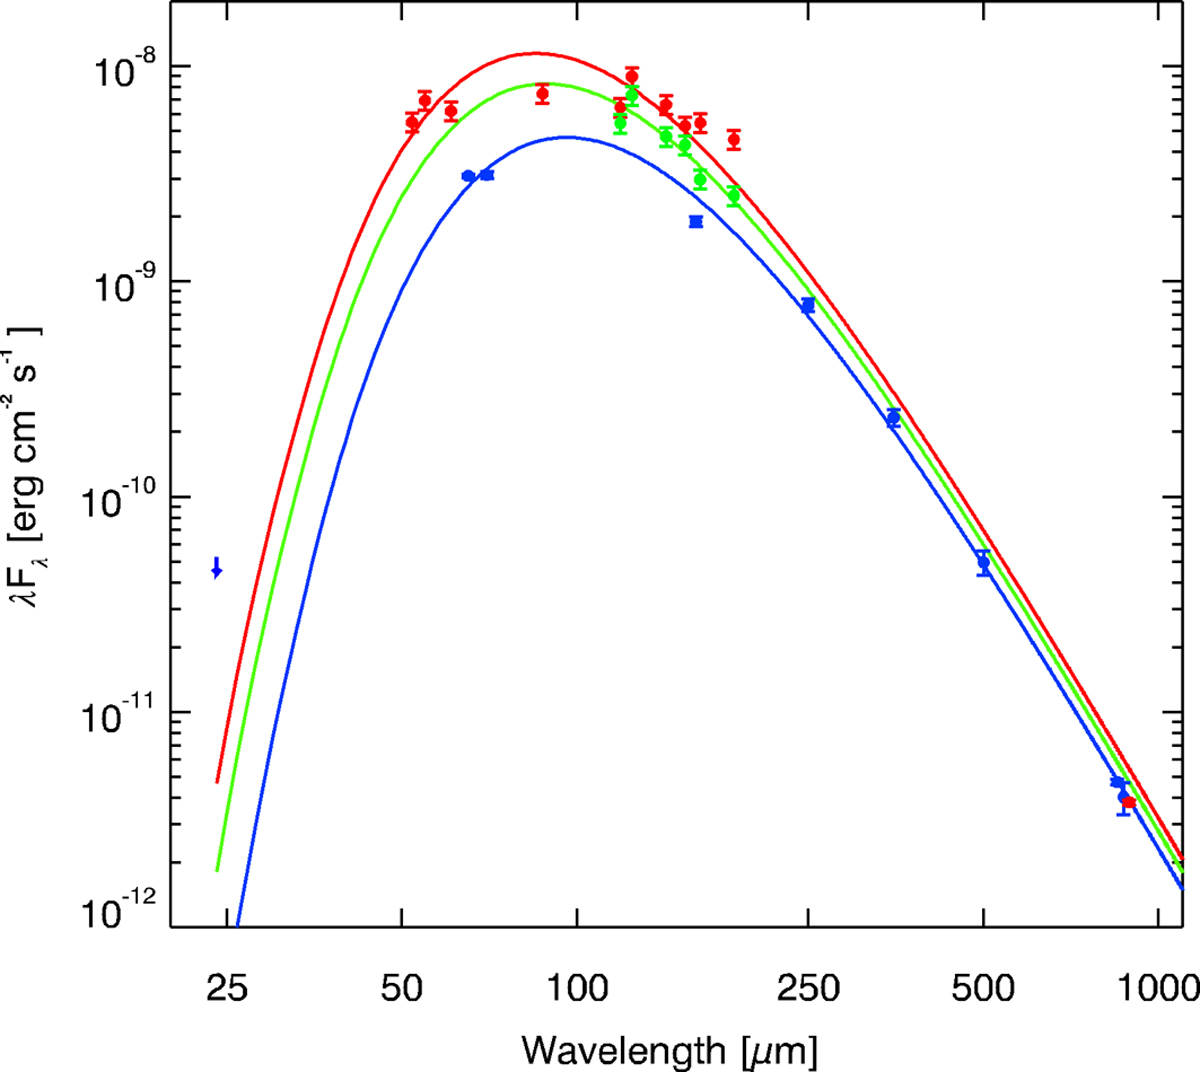
Observed FIR/(sub)mm SEDs showing pre-burst Herschel/ AKARI data (blue) and FIFI-LS burst values (red) together with the corresponding (sub)mm fluxes from Brogan et al. (2019). The upper 24 μm MIPS limit is indicated as well. The solid lines represent the reddened graybody fits (cf. Sect. 4.1). The second epoch FIFI-LS data and the corresponding fit appear bf in green.
Current usage metrics show cumulative count of Article Views (full-text article views including HTML views, PDF and ePub downloads, according to the available data) and Abstracts Views on Vision4Press platform.
Data correspond to usage on the plateform after 2015. The current usage metrics is available 48-96 hours after online publication and is updated daily on week days.
Initial download of the metrics may take a while.