Fig. 3
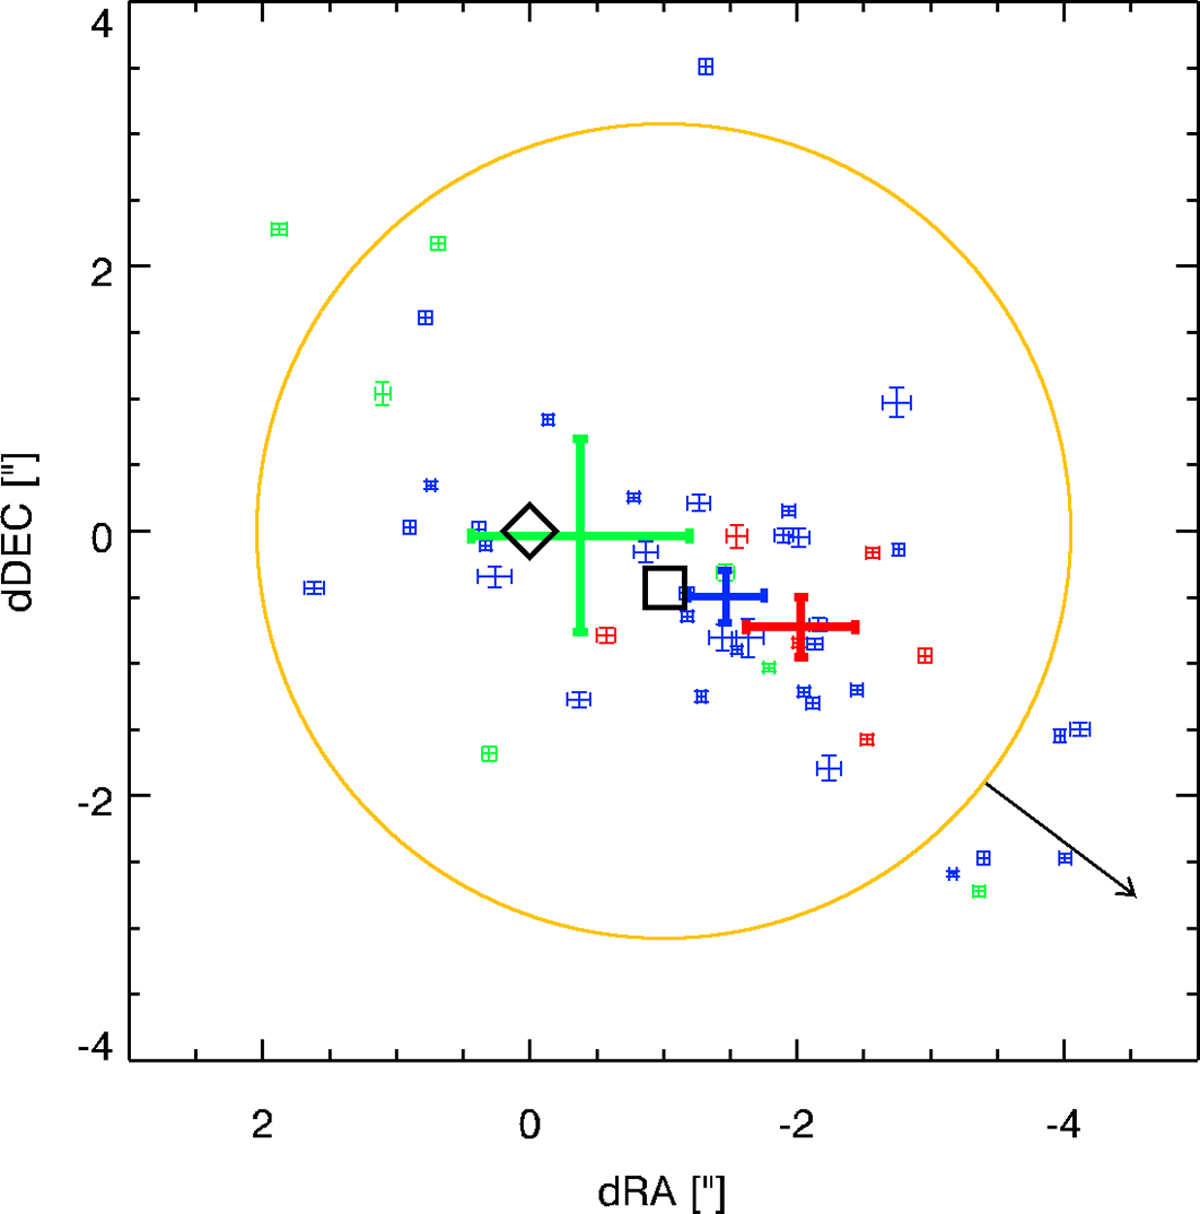
(NEO)WISE coordinate offsets relative to an origin at MM1 (from Brogan et al. 2019). Pre-burst, burst, and post-burst data are shown in blue, red and green. Thick error bars represent mean positions while individual appear thin. Positions of MM1 and MM3 (measured with ALMA) are marked by the diamond and the square, respectively. The arrow points toward the bright 2MASS J17431001−2951460, which is at a distance of 9.′′9 from the (0,0) position. The yellow circle indicates the W1 image FWHM of 6.′′ 1.
Current usage metrics show cumulative count of Article Views (full-text article views including HTML views, PDF and ePub downloads, according to the available data) and Abstracts Views on Vision4Press platform.
Data correspond to usage on the plateform after 2015. The current usage metrics is available 48-96 hours after online publication and is updated daily on week days.
Initial download of the metrics may take a while.