Fig. 2
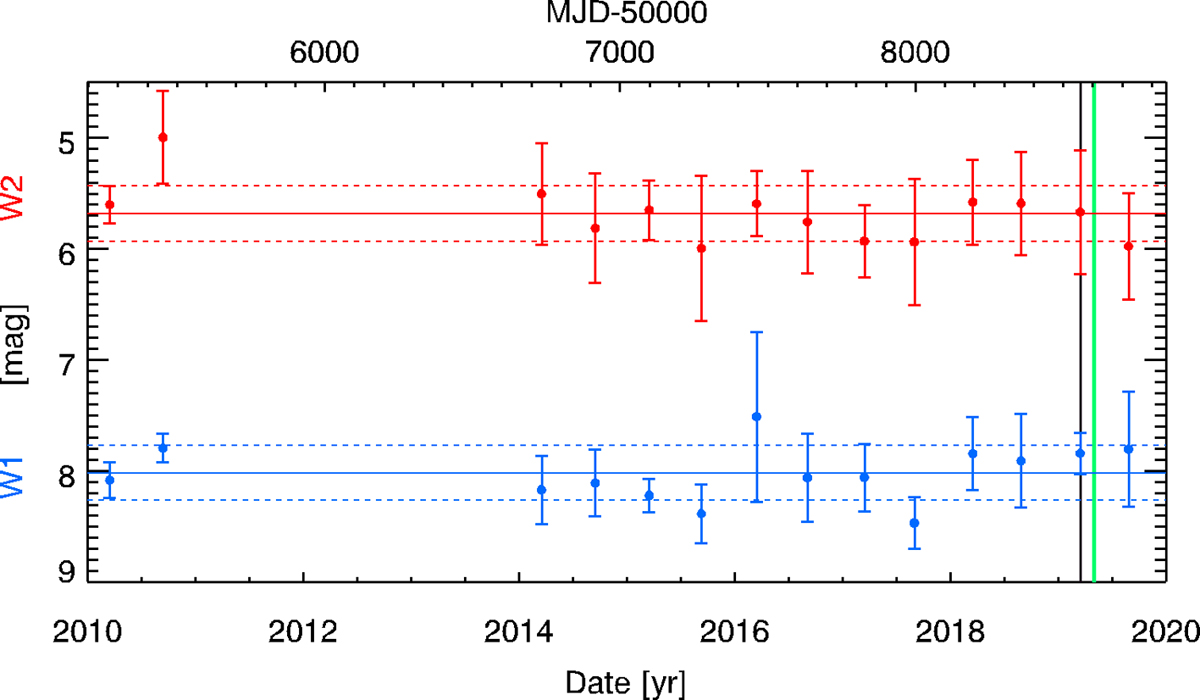
(NEO)WISE W1 (blue) and W2 (red) light curves based on mean magnitudes and respective errors for each visit. The first two epochs are from the WISE mission. Vertical lines mark the dates of the flare peak (black) and the first FIFI-LS epoch (green). Horizontal lines indicate mean magnitudes (solid) and their errors (dashed).
Current usage metrics show cumulative count of Article Views (full-text article views including HTML views, PDF and ePub downloads, according to the available data) and Abstracts Views on Vision4Press platform.
Data correspond to usage on the plateform after 2015. The current usage metrics is available 48-96 hours after online publication and is updated daily on week days.
Initial download of the metrics may take a while.