Fig. A.2
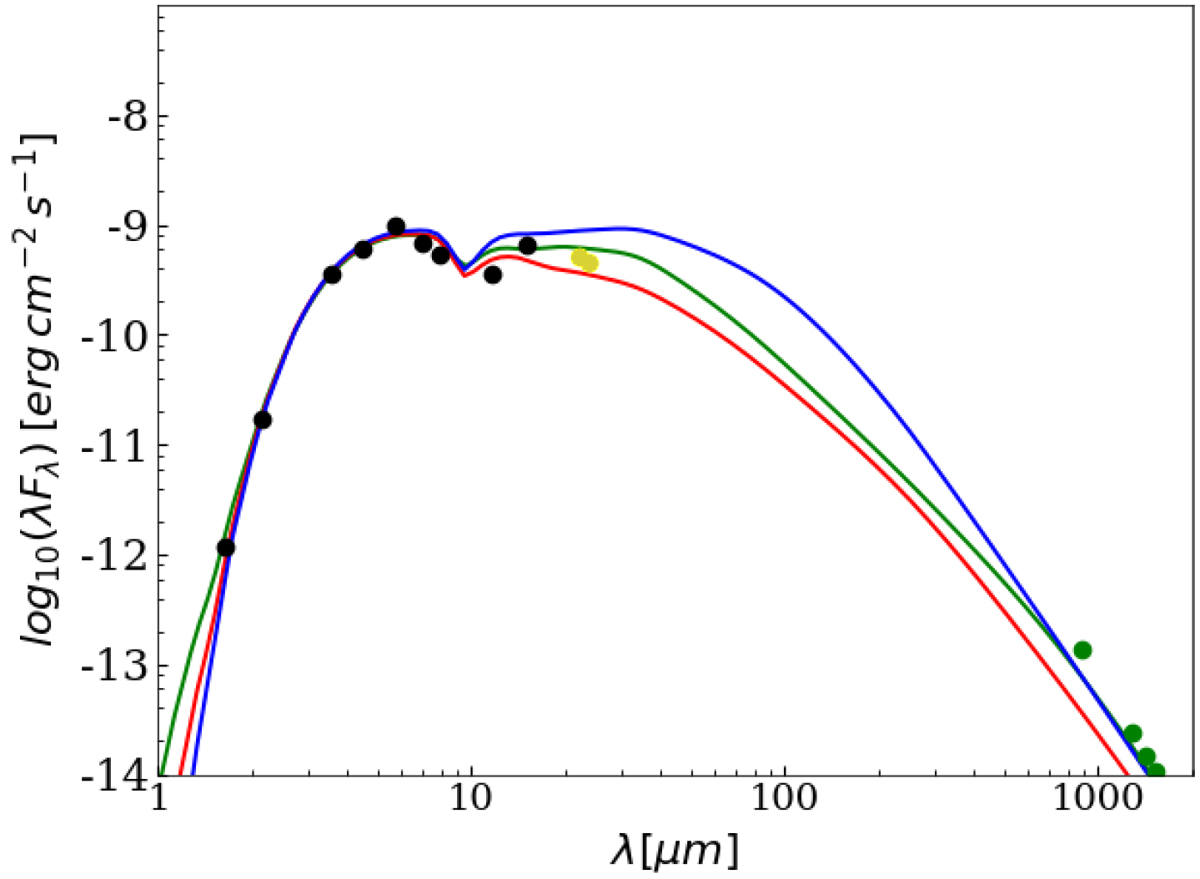
MM3 RT models illustrating constraints on the FIR emission. Filled circles indicate measured fluxes. The model shown in green is the best one (cf. Fig. 5). The best fit with the (sub)mm fluxes (green) omitted is shown in red. When also omitting the WISE W4 and MIPS 24 μm measurements (yellow), the best fit (blue) lies above the nominal one. This confirms that the FIR emission of MM3 and, thus, its contribution to the total FIR fluxes, is well constrained by the WISE, MIPS and ALMA measurements.
Current usage metrics show cumulative count of Article Views (full-text article views including HTML views, PDF and ePub downloads, according to the available data) and Abstracts Views on Vision4Press platform.
Data correspond to usage on the plateform after 2015. The current usage metrics is available 48-96 hours after online publication and is updated daily on week days.
Initial download of the metrics may take a while.