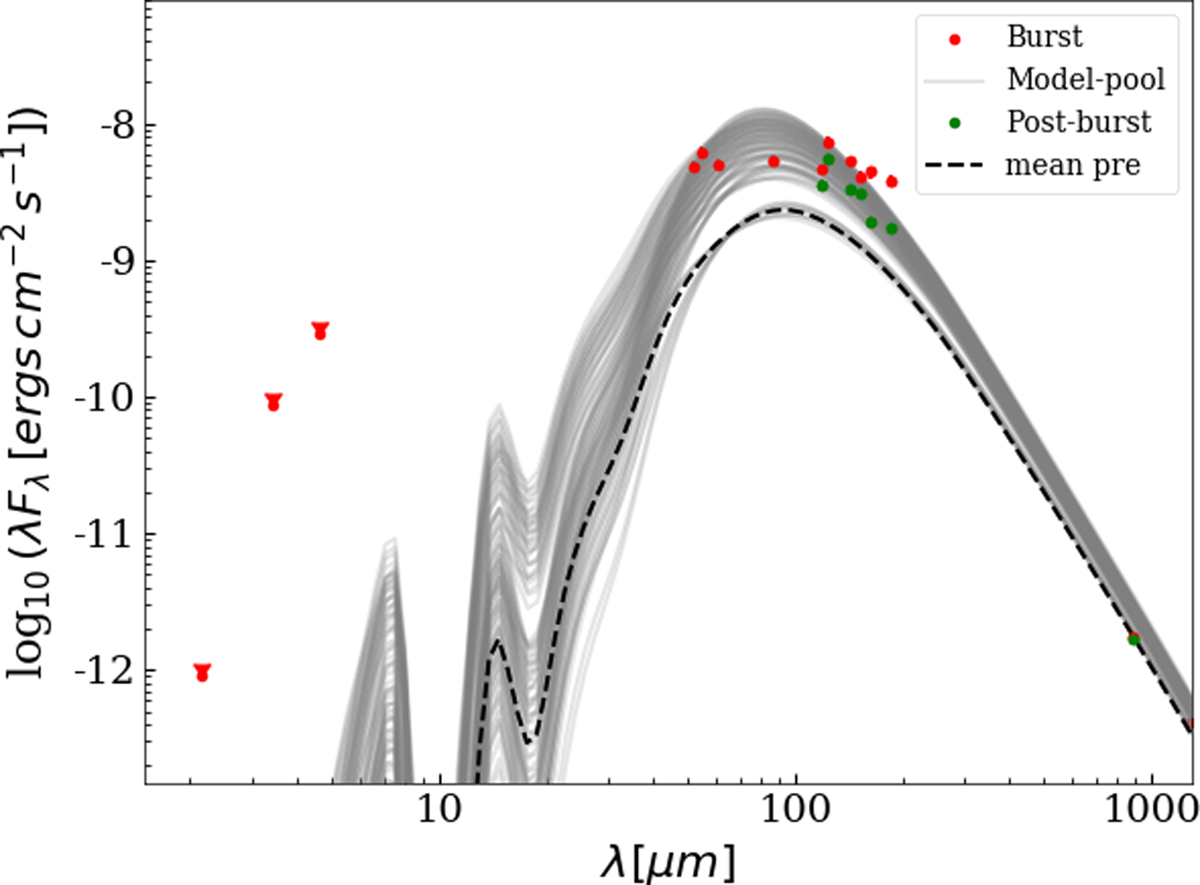
Fig. A.1

Model pool (in gray) showing all SEDs, used to fit burst and post-burst epochs. The observed fluxes from both epochs are plotted in red (burst) and green (post-burst). They are well covered by the model SEDs (except for the burst data points at 163 and 186 μm, as discussed when introducing the model pool in Sect. 5.2.2). The dashed black line indicates the mean model, as obtained from the pre-burst fit alone. The NIR/MIR fluxes of that model have been used to set a lower limit to the post-burst, which was only observed in the red channel of FIFI (at λ ≥ 118 μm).
Current usage metrics show cumulative count of Article Views (full-text article views including HTML views, PDF and ePub downloads, according to the available data) and Abstracts Views on Vision4Press platform.
Data correspond to usage on the plateform after 2015. The current usage metrics is available 48-96 hours after online publication and is updated daily on week days.
Initial download of the metrics may take a while.


