Fig. 1
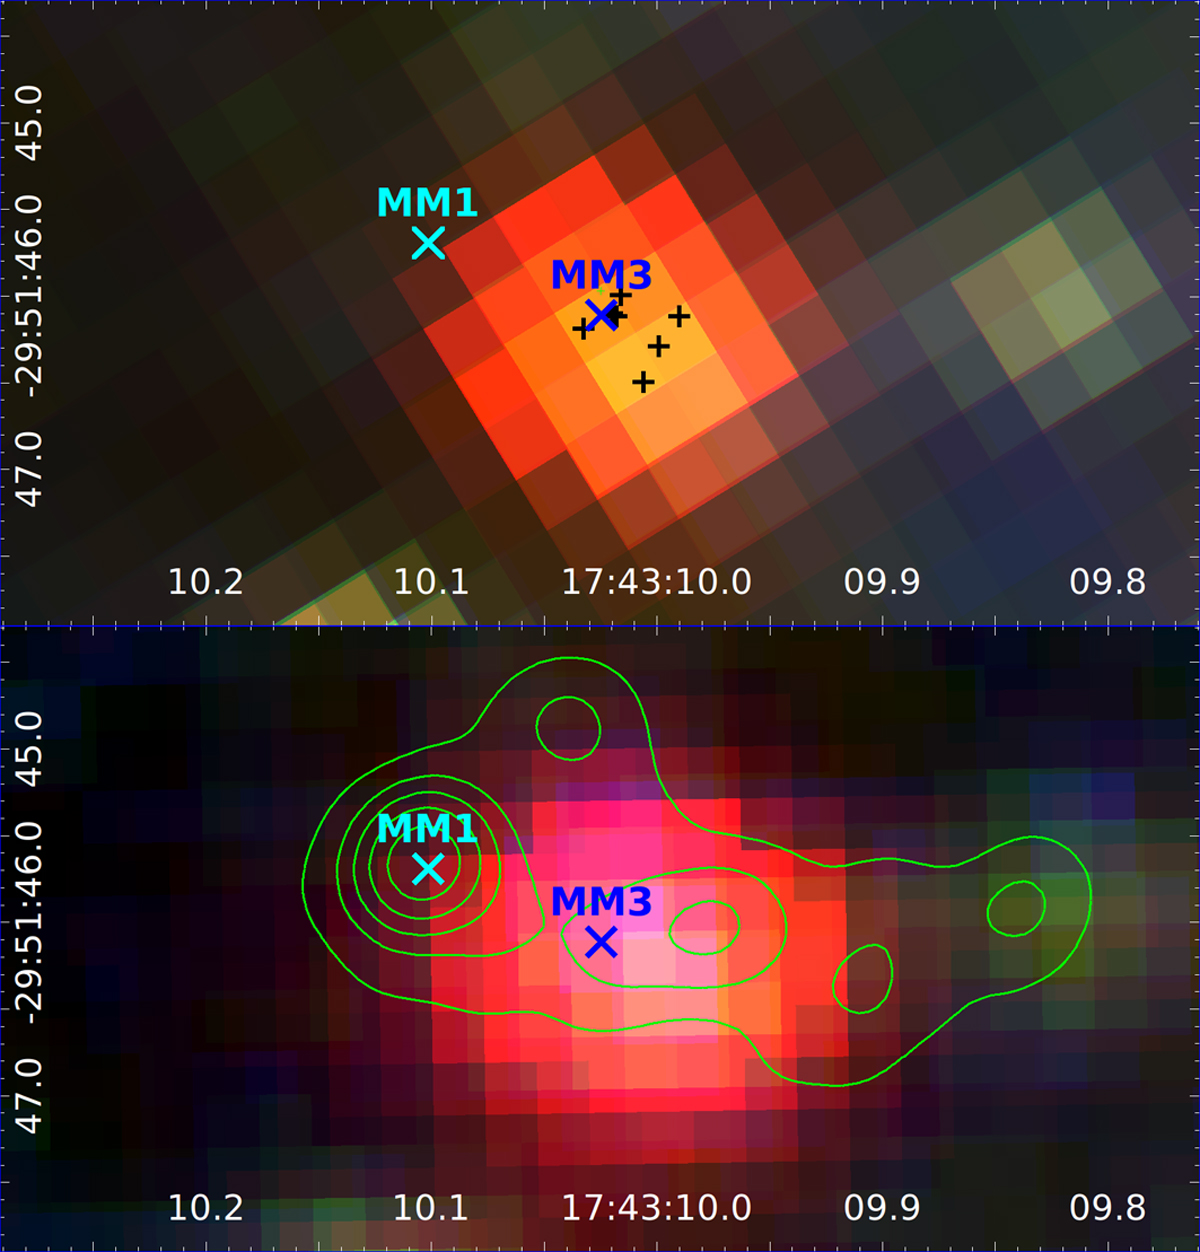
Top: VVV JHKs color composite of the G358 region (epoch 2010 August 15). The positions of MM1 and MM3 from Brogan et al. (2019) are marked. Black plus signs denote positions from IR observations at wavelengths up to 24 μm. Bottom: GROND JHKs color composite (epoch 2019 February 8) with contours of the ALMA 0.89 mm continuum map (Brogan et al. 2019).
Current usage metrics show cumulative count of Article Views (full-text article views including HTML views, PDF and ePub downloads, according to the available data) and Abstracts Views on Vision4Press platform.
Data correspond to usage on the plateform after 2015. The current usage metrics is available 48-96 hours after online publication and is updated daily on week days.
Initial download of the metrics may take a while.