Fig. 7
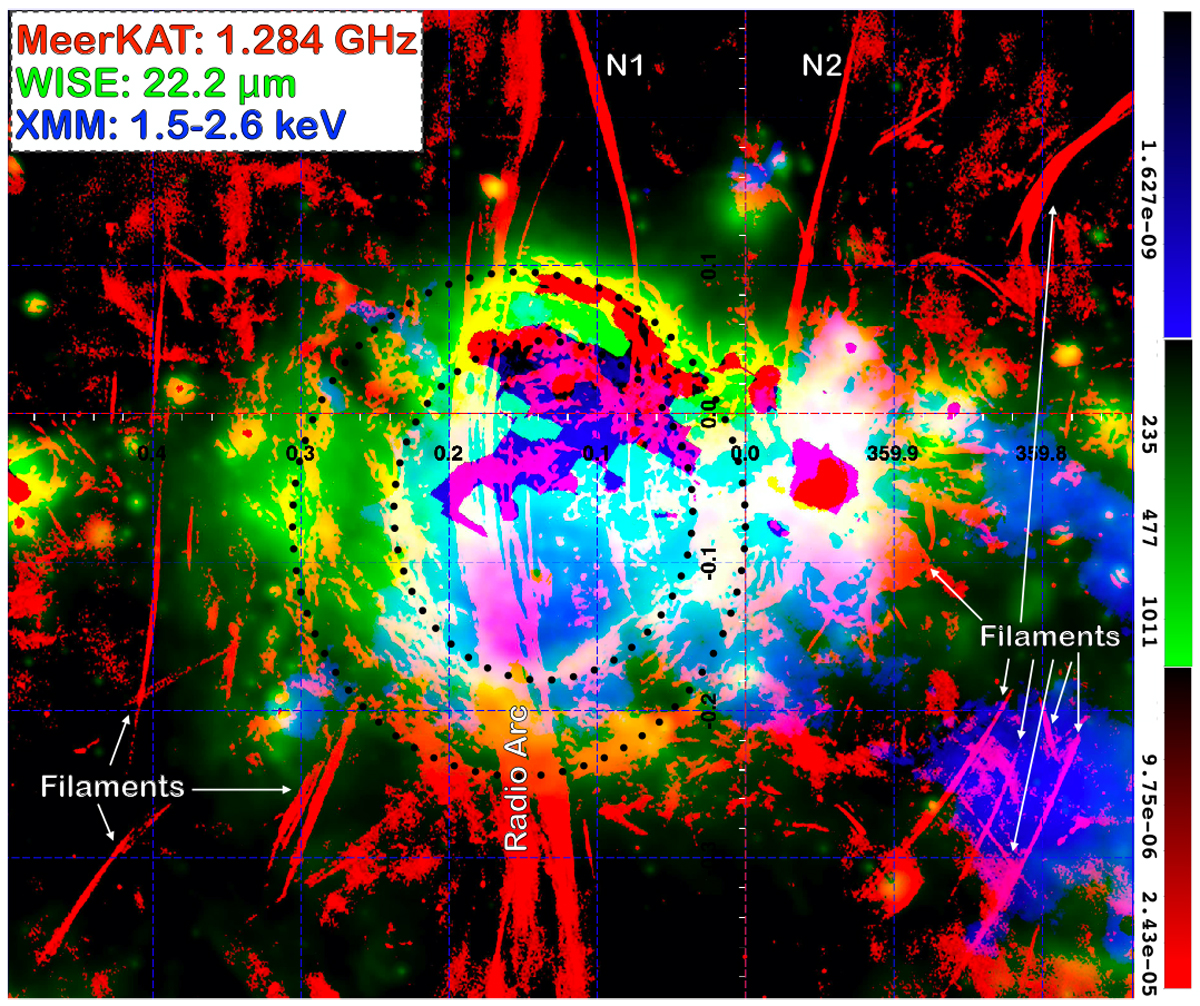
Multiwavelength view of the Arc super-bubble. Red colors show the MeerKAT map. Green colors show WISE 22.2 μm emission and the blue colors show the soft X-ray emission map (1.5–2.6 keV) of the region around the Arc super-bubble. The radio and mid-infrared emission are edge-brightened and trace the edges of the Arc super-bubble, while the X-ray emission appears to fill the central volume. Despite being edge-brightened, several bright stripes and arcs of radio emission, presumably tracing shocks, are projected toward the interior of the Arc super-bubble, as they are for the chimneys (some are highlighted by the two black dotted ellipses). The Radio Arc as well as many narrow, nonthermal filaments (some of which are highlighted by the white arrows) are clearly visible (see Fig. 2 for a definition of the Radio Arc and most prominent nonthermal filaments). Saturation and bright source removal in the WISE and XMM-Newton maps produce some visible artifacts.
Current usage metrics show cumulative count of Article Views (full-text article views including HTML views, PDF and ePub downloads, according to the available data) and Abstracts Views on Vision4Press platform.
Data correspond to usage on the plateform after 2015. The current usage metrics is available 48-96 hours after online publication and is updated daily on week days.
Initial download of the metrics may take a while.