Fig. 2
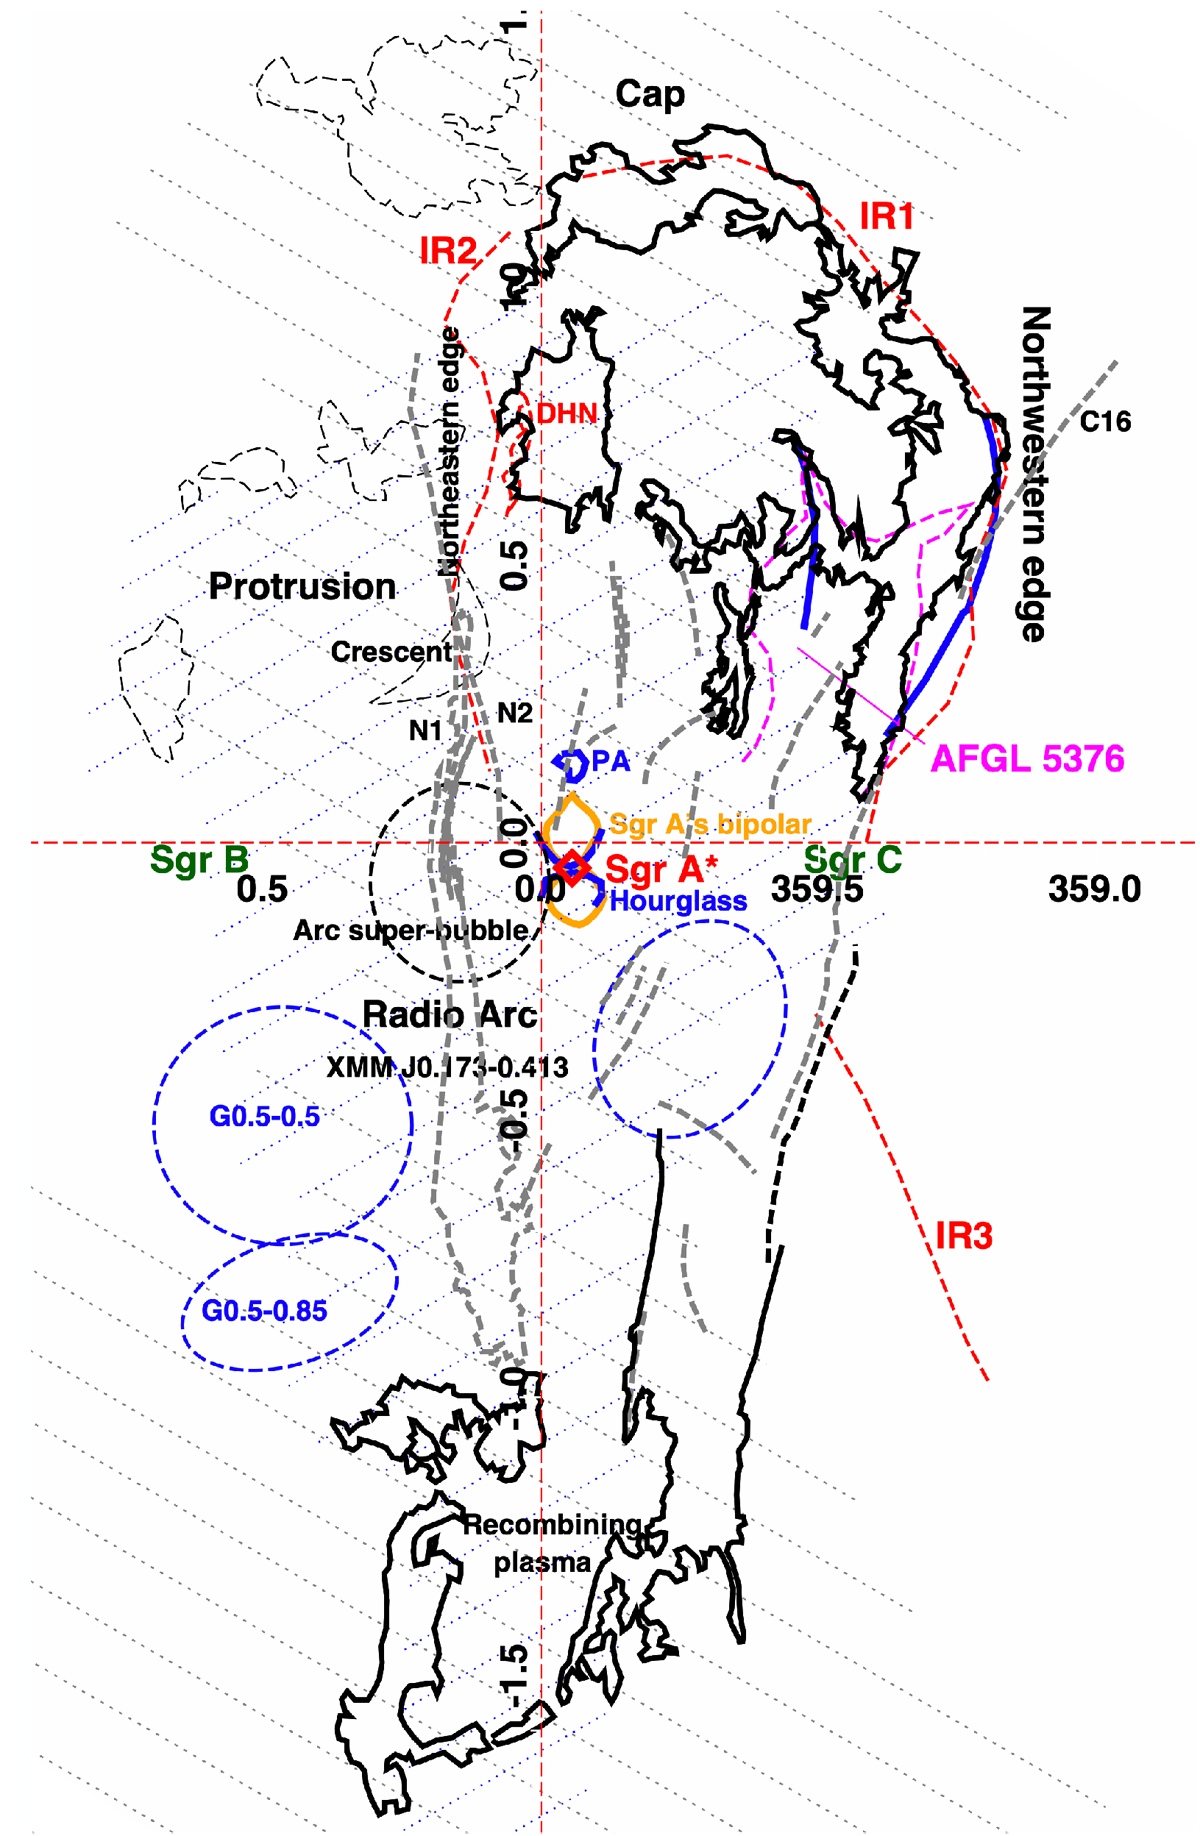
Finding chart of the region within and just outside the chimneys. The thick-black solid regions show the most prominent radio emitting features clearly associated with the chimneys. The thick dashed gray lines display thelocations of the most prominent nonthermal radio filaments (such as N1, N2, XMMJ 0.173-0.413, C16) and of the Radio Arc. The thick-red dashed lines display the location of the spurs of warm dust as evidenced from the WISE maps and the double helix nebula (DHN; Bland-Hawthorn & Cohen 2003; Enokiya et al. 2014). The magenta dashed lines indicate the borders of the AFGL 5376 feature, as derived from the WISE 22.2 μm map (the solid blue lines at this location show the position of the two shocks derived by Uchida et al. 1994). The slanting thin-dotted blue and gray lines show the X-ray emitting region displaying bright S xv and soft X-rayline radiation, respectively. At high latitudes, this emission extends beyond the borders of the chimneys. The thin-black dashed regions show the location of faint radio features appearing at the edges of the X-ray protrusion (Sect. 3.6). At the center, a red diamond shows the location of Sgr A⋆, the orange solid region displays the location of Sgr A’s bipolar lobes, as derived from the XMM-Newton map, while the blue solid regions show the location of the polar arc (PA) and of the hourglass feature (Hsieh et al. 2016). The latter runs almost perfectly on top of the lower edges of Sgr A’s bipolar lobes. The thick-black dashed ellipse shows the location of the Arc super-bubble as it appears in the radio and mid infrared bands, while the thick-blue dashed ellipses show the location of the three well-known foreground star forming regions. The dark green labelsindicate the position of the main molecular complexes (the Sgr A complex approximately coincides with Sgr A⋆).
Current usage metrics show cumulative count of Article Views (full-text article views including HTML views, PDF and ePub downloads, according to the available data) and Abstracts Views on Vision4Press platform.
Data correspond to usage on the plateform after 2015. The current usage metrics is available 48-96 hours after online publication and is updated daily on week days.
Initial download of the metrics may take a while.