Free Access
Fig. 9.
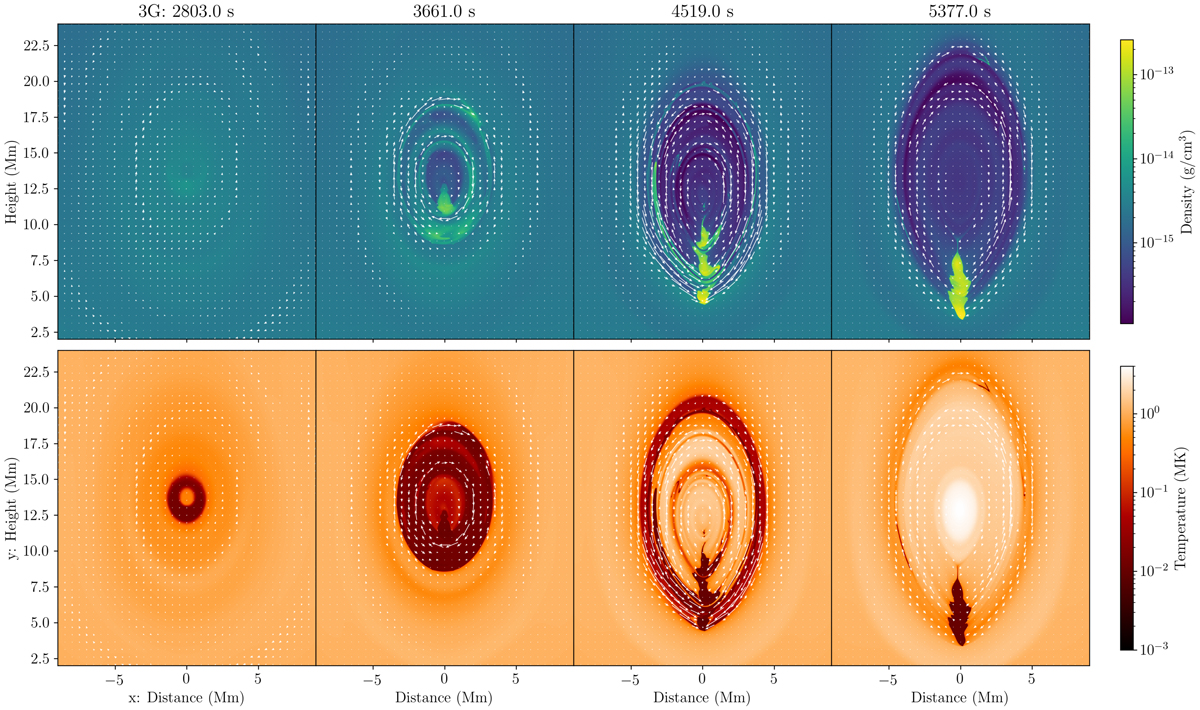
Evolution of the condensing material within the 3G formed flux rope. First row: evolution of the density, second: temperature. Velocity quivers of relative magnitude are overplotted as before. A movie of this figure, including ![]() and baroclinicity maps, is available online.
and baroclinicity maps, is available online.
Current usage metrics show cumulative count of Article Views (full-text article views including HTML views, PDF and ePub downloads, according to the available data) and Abstracts Views on Vision4Press platform.
Data correspond to usage on the plateform after 2015. The current usage metrics is available 48-96 hours after online publication and is updated daily on week days.
Initial download of the metrics may take a while.