Fig. 8.
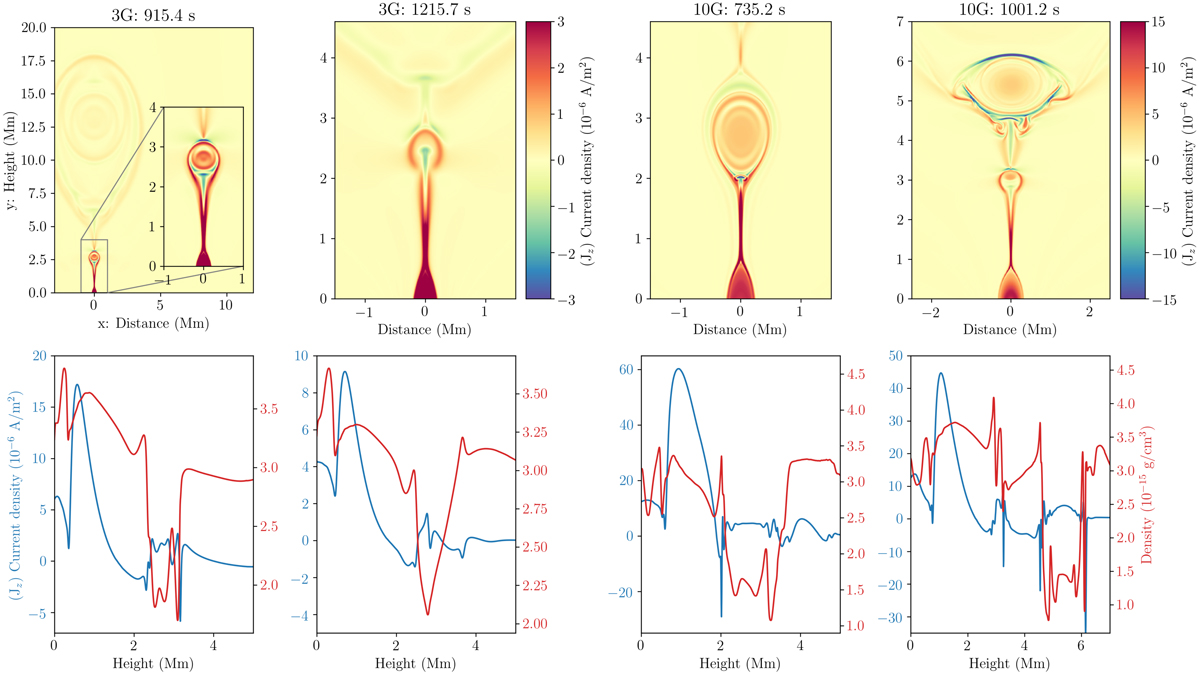
Production of subordinate flux ropes below the main rope and their involvement with the supply of material to the prominence. Top panels: distribution of Jz current density. Bottom panels: current and plasma density distribution in a vertical cut through the current sheet at x = 0. Left and right: construction of two additional flux ropes (t = 915.4, 1215.7 and t = 735.2, 1001.2 s) within the 3G and 10G cases, respectively.
Current usage metrics show cumulative count of Article Views (full-text article views including HTML views, PDF and ePub downloads, according to the available data) and Abstracts Views on Vision4Press platform.
Data correspond to usage on the plateform after 2015. The current usage metrics is available 48-96 hours after online publication and is updated daily on week days.
Initial download of the metrics may take a while.