Fig. 7.
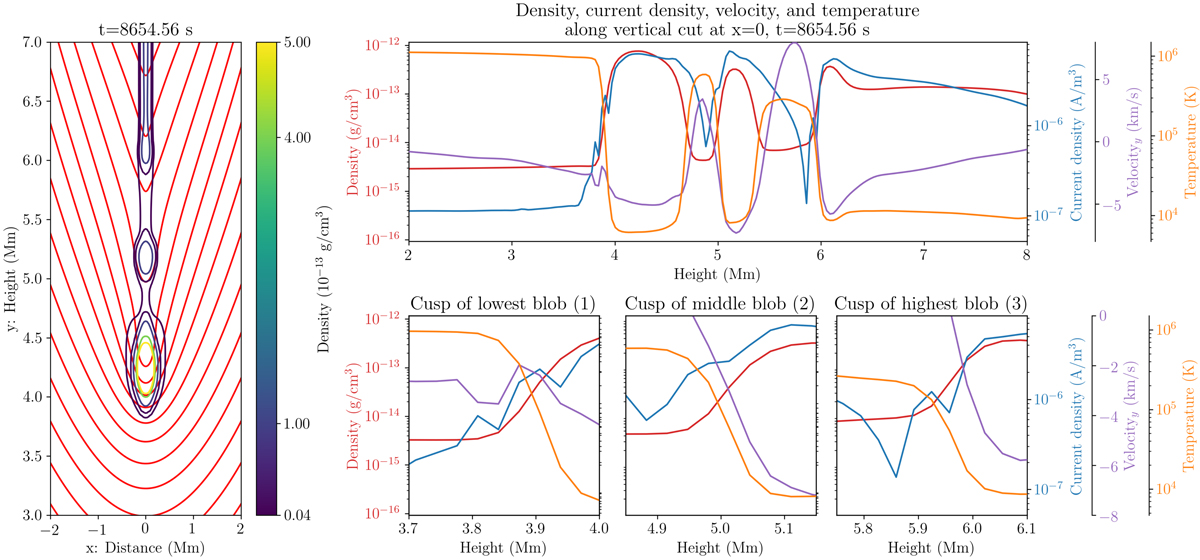
Magnetic field and density map, and stratification of plasma density, current density, vertical velocity, and temperature along a cut taken vertically through x = 0. Left: a zoom-in of the region containing the multiple prominence condensations. Magnetic field lines are plotted in red with density contours overlaid according to the colourbar. Top: stratification of the aforementioned plasma parameters between 2–8 Mm, isolating the three prominence consensations. Bottom: three panels focussing on the distribution of parameters across the cusp of each blob.
Current usage metrics show cumulative count of Article Views (full-text article views including HTML views, PDF and ePub downloads, according to the available data) and Abstracts Views on Vision4Press platform.
Data correspond to usage on the plateform after 2015. The current usage metrics is available 48-96 hours after online publication and is updated daily on week days.
Initial download of the metrics may take a while.