Fig. 6.
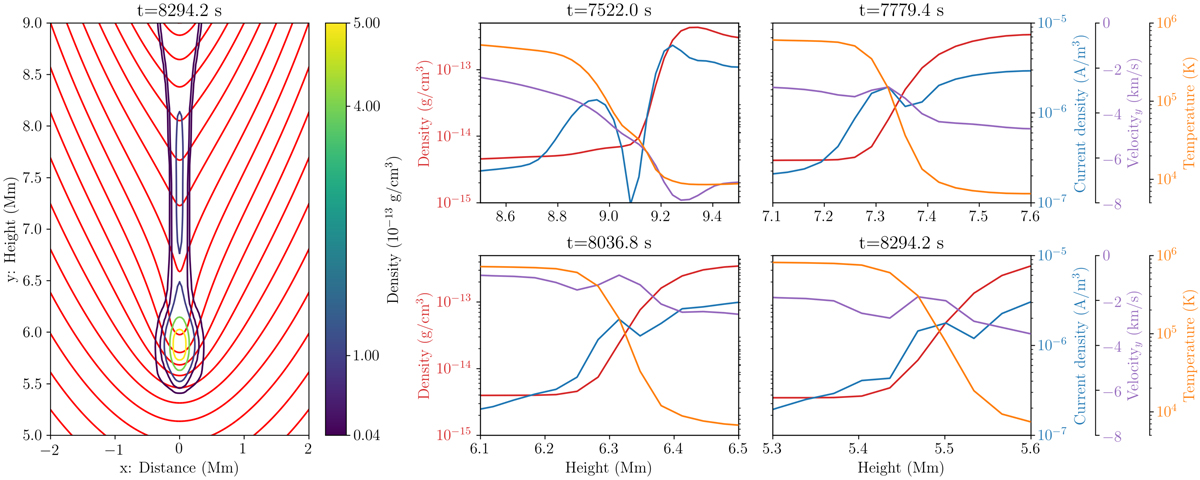
Magnetic field and density map, and the evolution of plasma density, current density, vertical velocity, and temperature along a cut taken vertically through x = 0. Left: zoom-in of the region containing the bottom of the prominence condensation. Magnetic field lines are plotted in red with density contours overlaid according to the colourbar. Right: four panels detailing the evolution of the aforementioned physical parameters across the leading edge of the falling condensation, times are indicated as titles to each plot.
Current usage metrics show cumulative count of Article Views (full-text article views including HTML views, PDF and ePub downloads, according to the available data) and Abstracts Views on Vision4Press platform.
Data correspond to usage on the plateform after 2015. The current usage metrics is available 48-96 hours after online publication and is updated daily on week days.
Initial download of the metrics may take a while.