Fig. 14.
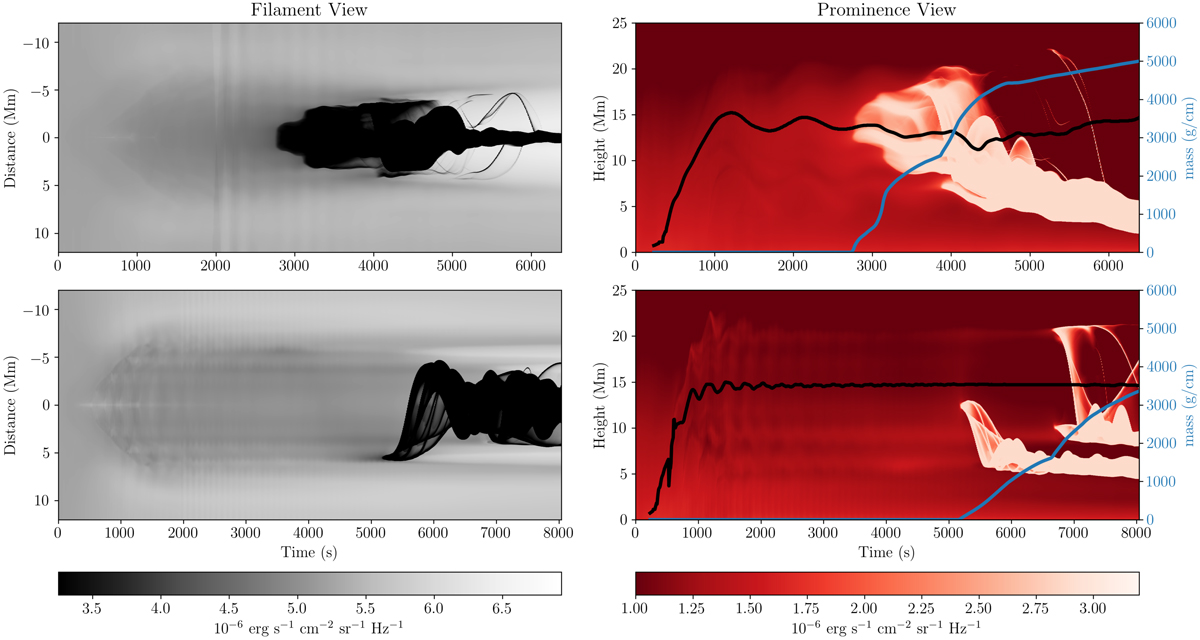
Filament (left) and prominence (H-α) visualisations (right) of the 3G (top) and 10G (bottom) cases using the method outlined in Heinzel et al. (2015). Right: evolution in the flux rope O-point and prominence mass are overplotted on the prominence evolution as the solid black and blue lines respectively. The large jump in altitude experienced by the 10G case is caused by the injection of the larger of two subordinate ropes into the main forming rope (cf. Fig. 8).
Current usage metrics show cumulative count of Article Views (full-text article views including HTML views, PDF and ePub downloads, according to the available data) and Abstracts Views on Vision4Press platform.
Data correspond to usage on the plateform after 2015. The current usage metrics is available 48-96 hours after online publication and is updated daily on week days.
Initial download of the metrics may take a while.