Fig. 13.
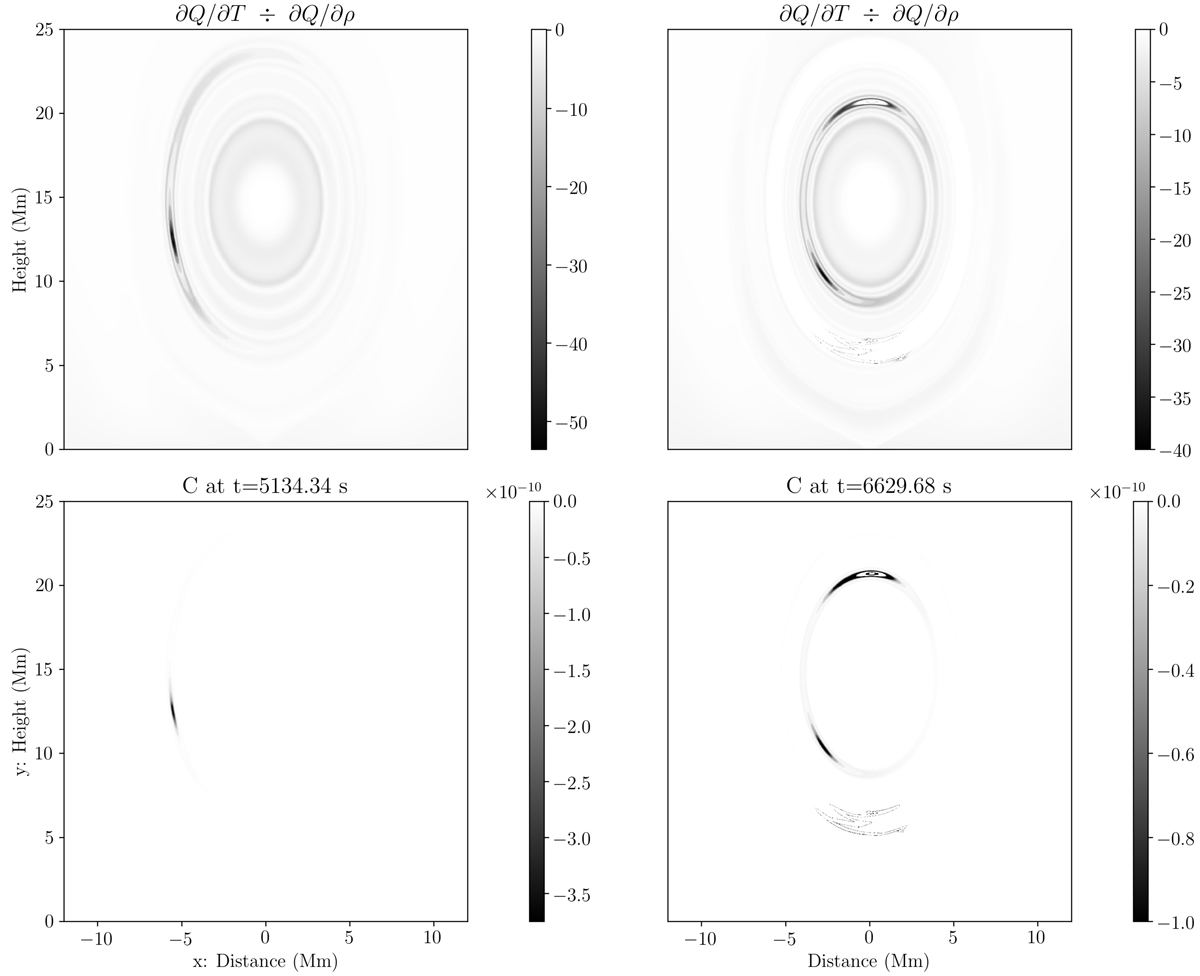
Locations of TI within the 10G prominence just prior to the two main episodes of condensation formation (left: 5134.34 s and right: 6629.68 s). Top: ratio of thermal to density influence on the varying energy loss 𝒬 term in Eq. (3). Bottom: spatial map of the isochoric linear stability metric C (Eq. (23)) for the thermal mode instability.
Current usage metrics show cumulative count of Article Views (full-text article views including HTML views, PDF and ePub downloads, according to the available data) and Abstracts Views on Vision4Press platform.
Data correspond to usage on the plateform after 2015. The current usage metrics is available 48-96 hours after online publication and is updated daily on week days.
Initial download of the metrics may take a while.