Fig. 8.
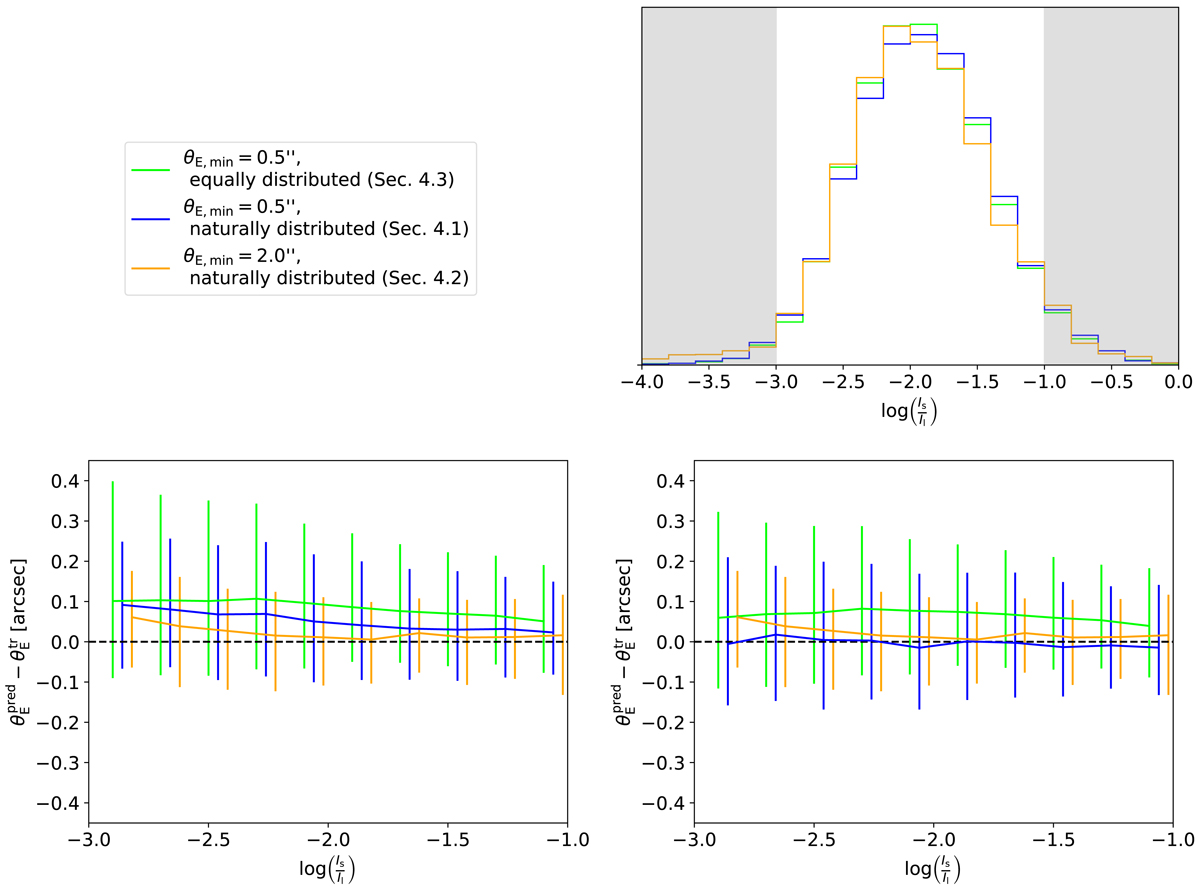
Comparison of the performance of the three networks described in Sect. 4. All samples include doubles and quads and a weighting factor of wθE = 5, but different Einstein radius distribution or lower limits on the Einstein radius as indicated in the legend (upper left). Upper right panel: histogram of the brightness ratio of lensed source and lens. Bottom panel: for the full sample (left) and limited to θE > 0.8″ (right) the difference in Einstein radius as a function of the brightness ratio with the 1σ values. Shown are the Einstein radius difference in the range ![]() (white area in the histogram) where there are enough data points, and the blue and orange bars have been shifted slightly to the right for better visualization.
(white area in the histogram) where there are enough data points, and the blue and orange bars have been shifted slightly to the right for better visualization.
Current usage metrics show cumulative count of Article Views (full-text article views including HTML views, PDF and ePub downloads, according to the available data) and Abstracts Views on Vision4Press platform.
Data correspond to usage on the plateform after 2015. The current usage metrics is available 48-96 hours after online publication and is updated daily on week days.
Initial download of the metrics may take a while.