Fig. 7.
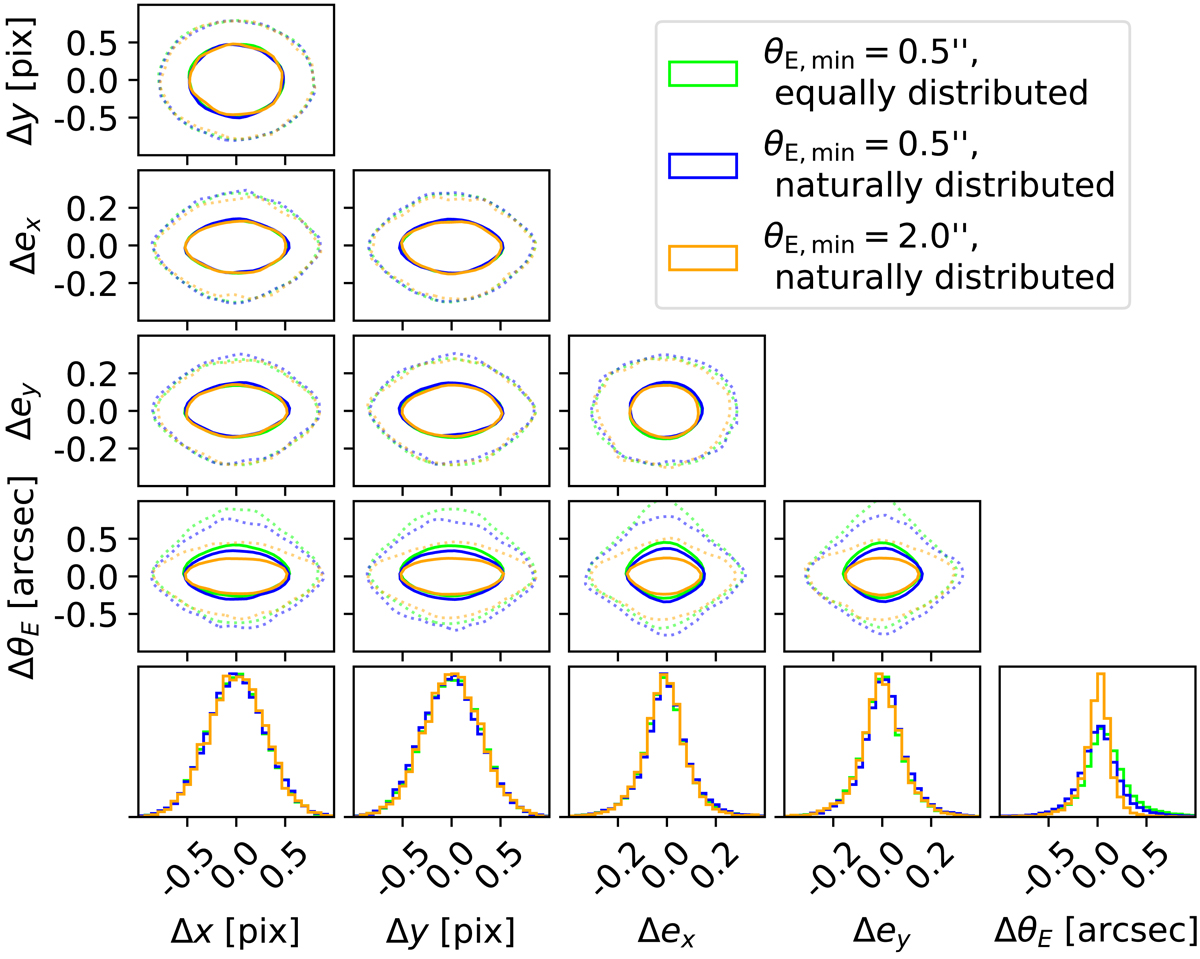
Comparison of the performance of the three networks described in Sect. 4. All samples include doubles and quads and a weighting factor of wθE = 5, but different Einstein radius distributions or lower limits on the Einstein radius (see legend). Bottom row: normalized histograms of the difference between predicted values and ground truth for the five parameters and above the 2D correlations distribution: 1σ contour (solid line) and 2σ contour (dotted line).
Current usage metrics show cumulative count of Article Views (full-text article views including HTML views, PDF and ePub downloads, according to the available data) and Abstracts Views on Vision4Press platform.
Data correspond to usage on the plateform after 2015. The current usage metrics is available 48-96 hours after online publication and is updated daily on week days.
Initial download of the metrics may take a while.