Fig. 6.
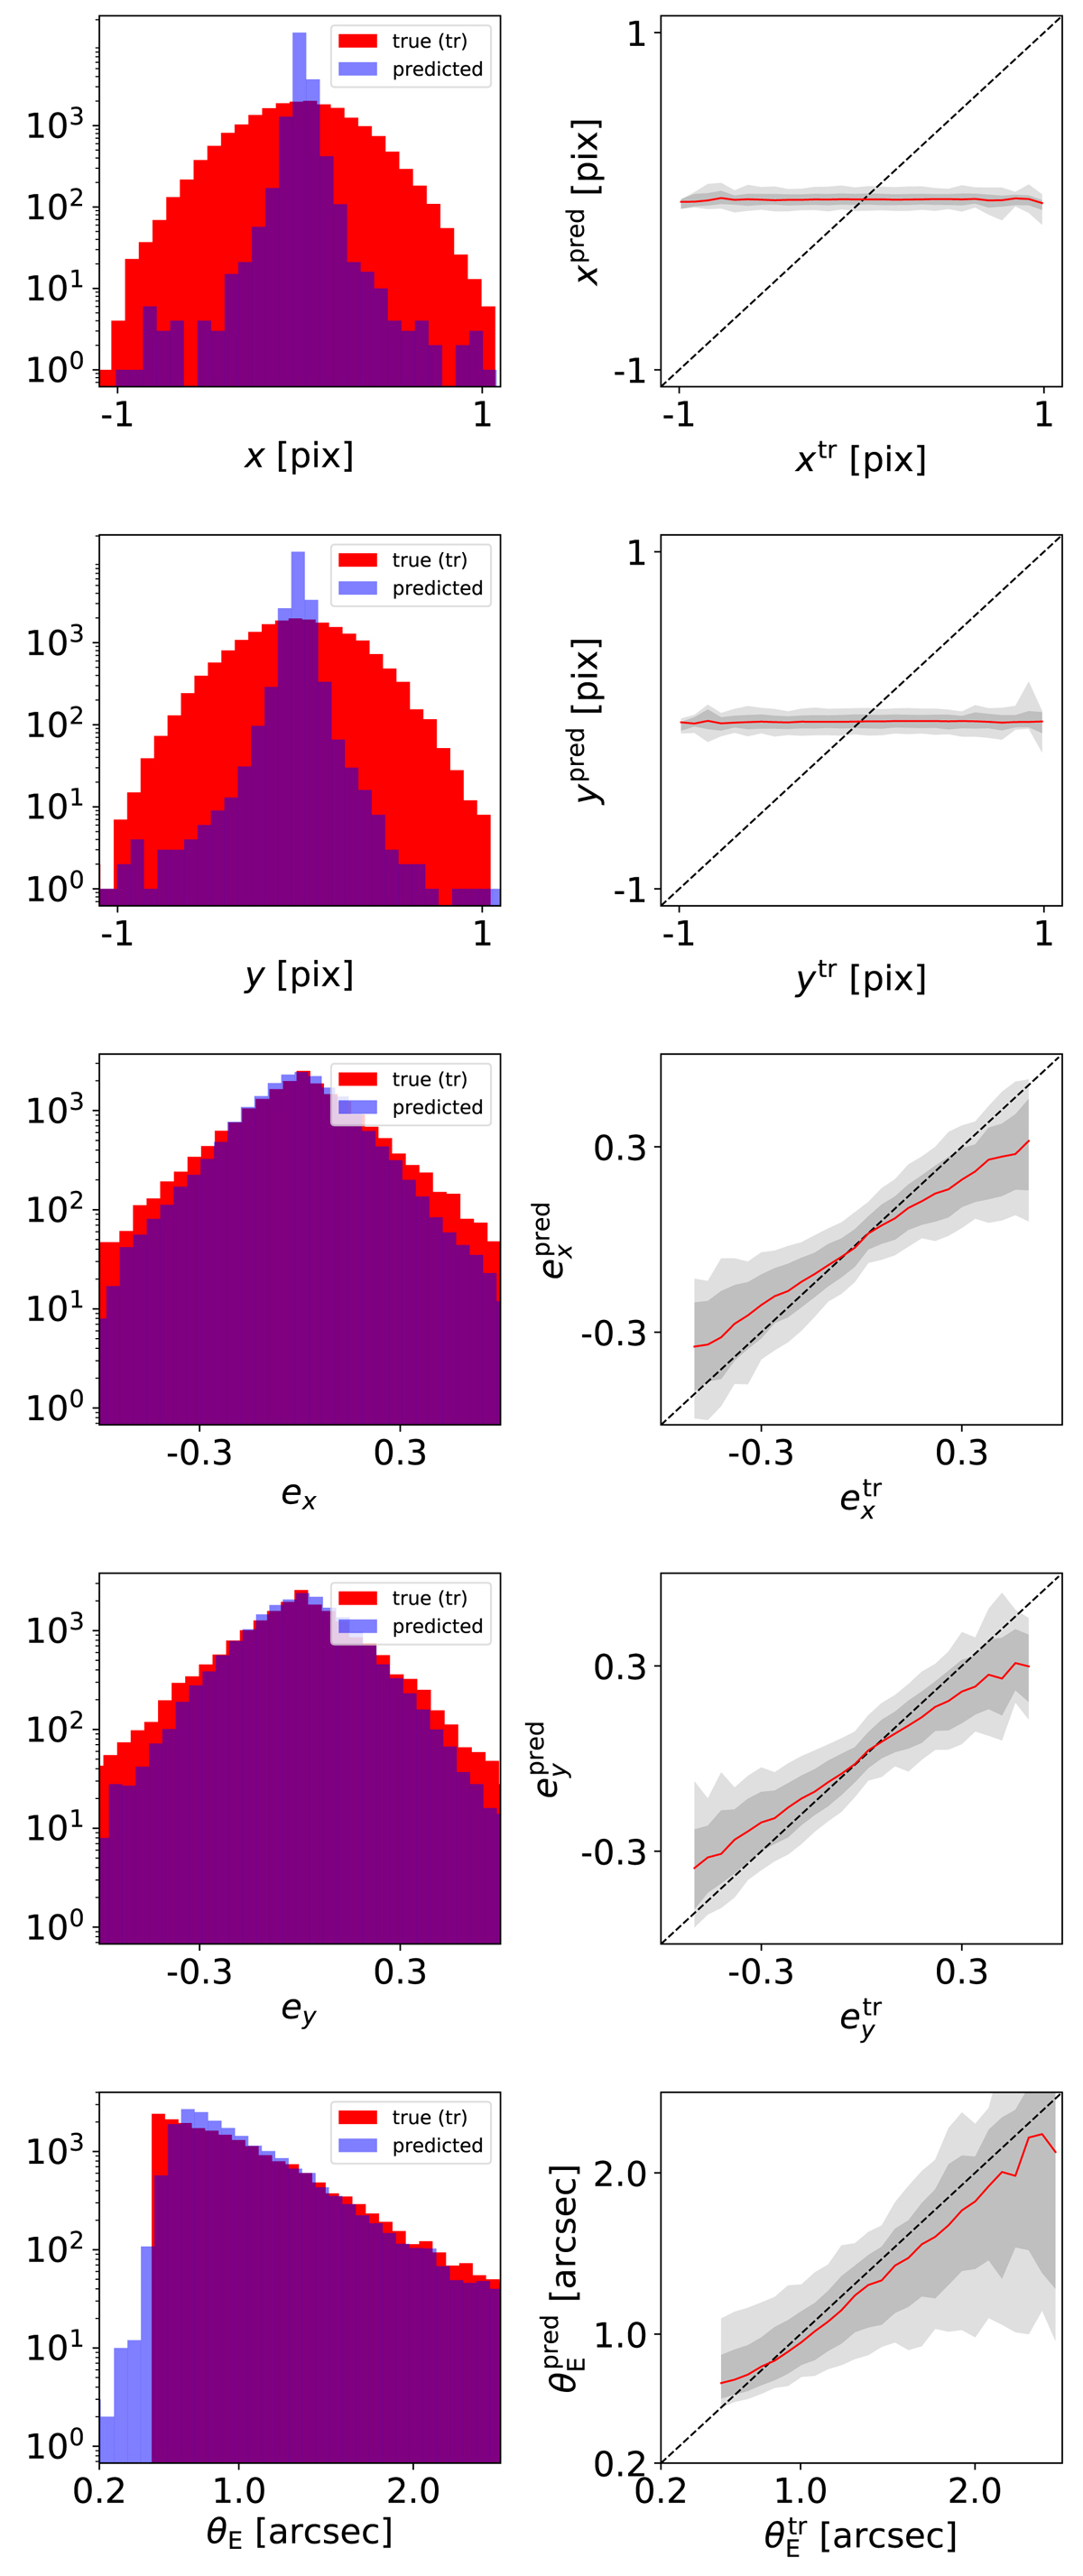
Network performance on the Einstein radius under the assumption of a lowest Einstein radius θE, min of 0.5″ and a weighting factor of wθE = 5. Left panel: histograms of the ground truth (tr) in red and of the predicted values in blue. Right panel: direct comparison of the predicted against the true value, where the red line indicates the median of the distribution and the gray bands give the 1σ (16th to 84th percentile) and 2σ (2.5th to 97.5th percentile) ranges. From top to bottom: are the five different model parameters, lens center x and y, complex ellipticity ex and ey, and Einstein radius θE. For all plots 30 bins over the plotting range are used.
Current usage metrics show cumulative count of Article Views (full-text article views including HTML views, PDF and ePub downloads, according to the available data) and Abstracts Views on Vision4Press platform.
Data correspond to usage on the plateform after 2015. The current usage metrics is available 48-96 hours after online publication and is updated daily on week days.
Initial download of the metrics may take a while.