Fig. 14.
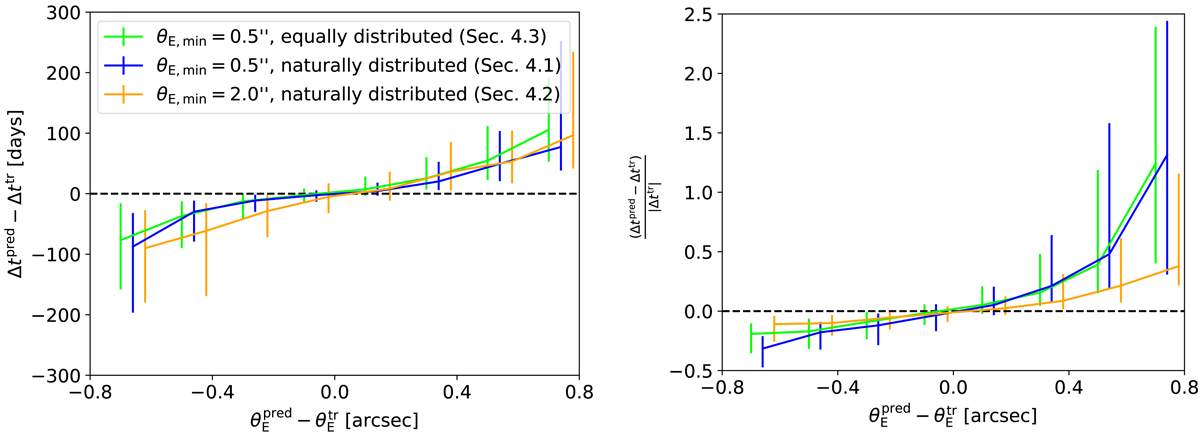
Correlation between Einstein radius offset in the range ![]() and time-delay difference (left panel) or fractional time-delay difference (right panel) by applying the different networks to their samples after limiting to
and time-delay difference (left panel) or fractional time-delay difference (right panel) by applying the different networks to their samples after limiting to ![]() . The blue and orange bars have been shifted slightly to the right for better visualization.
. The blue and orange bars have been shifted slightly to the right for better visualization.
Current usage metrics show cumulative count of Article Views (full-text article views including HTML views, PDF and ePub downloads, according to the available data) and Abstracts Views on Vision4Press platform.
Data correspond to usage on the plateform after 2015. The current usage metrics is available 48-96 hours after online publication and is updated daily on week days.
Initial download of the metrics may take a while.