Fig. 13.
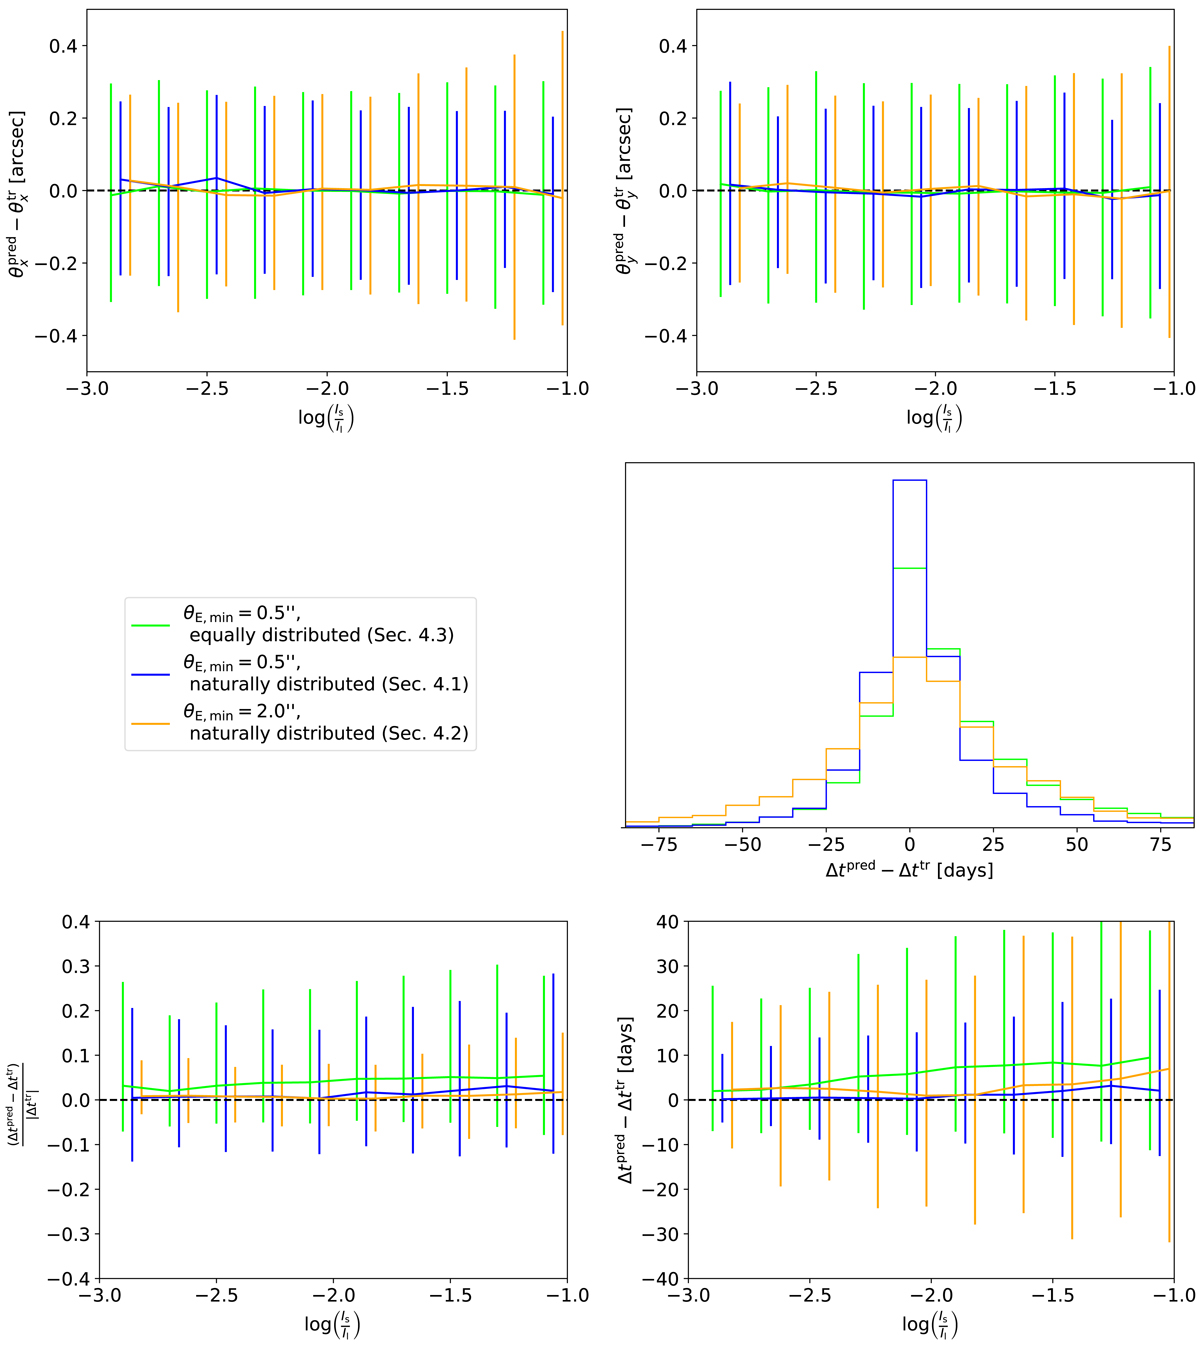
Precision of model network predictions as a function of the lens and lensed source brightness ratio in the range ![]() for the three networks presented in Sect. 4 applied to the restricted sample with
for the three networks presented in Sect. 4 applied to the restricted sample with ![]() . Upper row: image position offset for the x coordinate (left) and y coordinate (right). Middle panel: legend (left) and histogram of the difference in time-delay (right), bottom row: fraction of the time-delay difference and the true time-delay (left) and the time-delay difference (right). The curves show the median and the vertical bars the 1σ values. The blue and orange bars have been shifted slightly to the right for better visualization.
. Upper row: image position offset for the x coordinate (left) and y coordinate (right). Middle panel: legend (left) and histogram of the difference in time-delay (right), bottom row: fraction of the time-delay difference and the true time-delay (left) and the time-delay difference (right). The curves show the median and the vertical bars the 1σ values. The blue and orange bars have been shifted slightly to the right for better visualization.
Current usage metrics show cumulative count of Article Views (full-text article views including HTML views, PDF and ePub downloads, according to the available data) and Abstracts Views on Vision4Press platform.
Data correspond to usage on the plateform after 2015. The current usage metrics is available 48-96 hours after online publication and is updated daily on week days.
Initial download of the metrics may take a while.