Fig. 12.
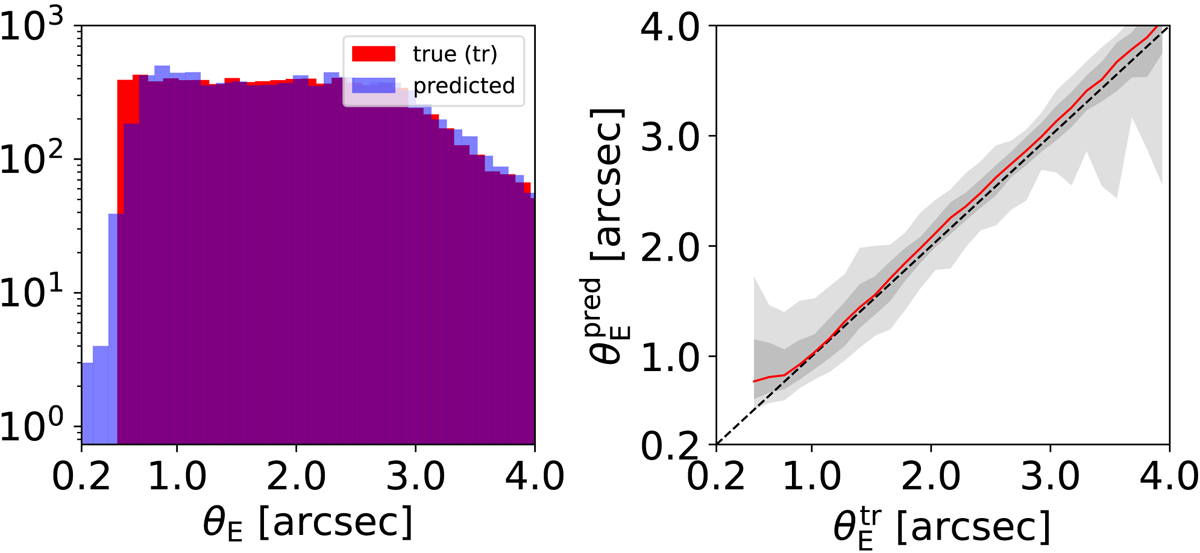
Network performance under the assumption of a lowest Einstein radius θE, min of 0.5″ but a uniform distribution with quadruply lensed images. Left panel: histograms of the ground truth (tr) in red and of the predicted values in blue. Right panel: 1:1 plot of predicted against true Einstein radius. For both plots 30 bins over the plotting range are used.
Current usage metrics show cumulative count of Article Views (full-text article views including HTML views, PDF and ePub downloads, according to the available data) and Abstracts Views on Vision4Press platform.
Data correspond to usage on the plateform after 2015. The current usage metrics is available 48-96 hours after online publication and is updated daily on week days.
Initial download of the metrics may take a while.