Fig. 11.
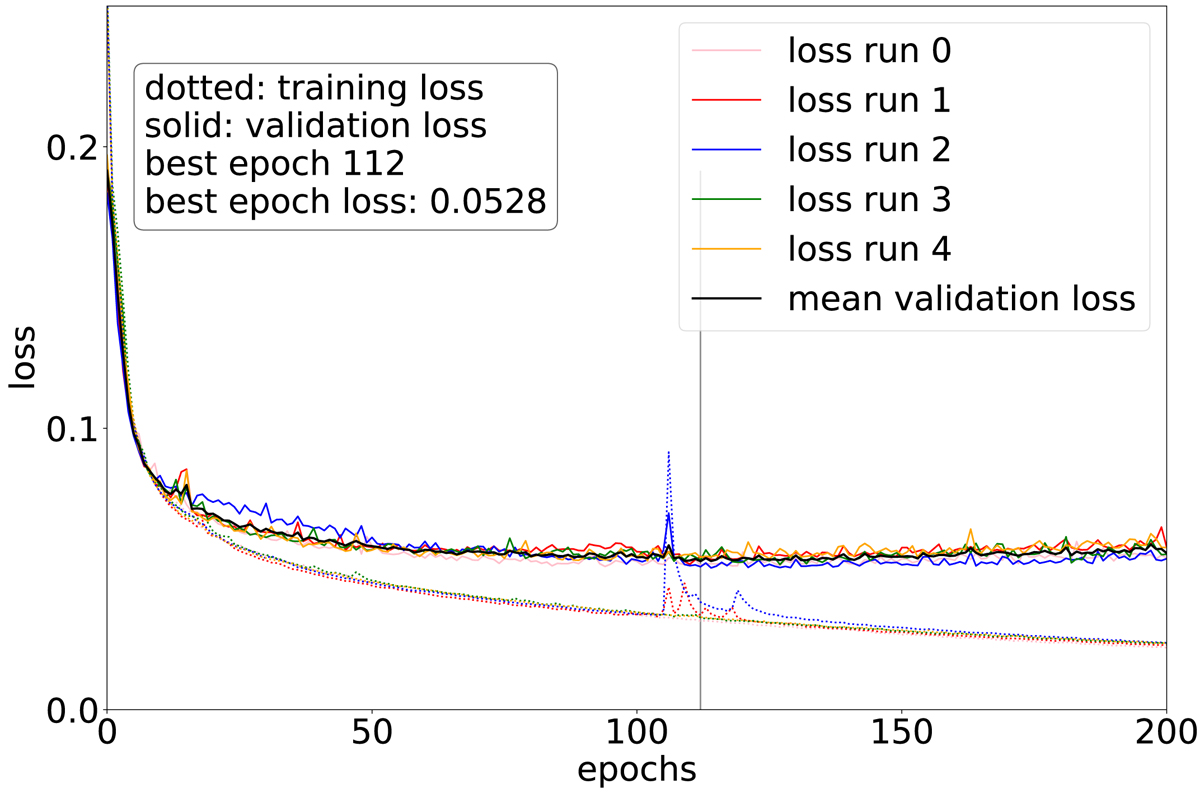
Loss curve of our best network under the assumption of equally distributed Einstein radii. The training loss is shown as dotted lines in five different colors for the five different cross-validation runs. In the same colors the validation loss is shown as solid lines together with the black curve, which is the average of the five validation curves from the cross-validation runs. From the minimum in the black curve, shown as the vertical gray line, the best epoch is found.
Current usage metrics show cumulative count of Article Views (full-text article views including HTML views, PDF and ePub downloads, according to the available data) and Abstracts Views on Vision4Press platform.
Data correspond to usage on the plateform after 2015. The current usage metrics is available 48-96 hours after online publication and is updated daily on week days.
Initial download of the metrics may take a while.