Fig. 1.
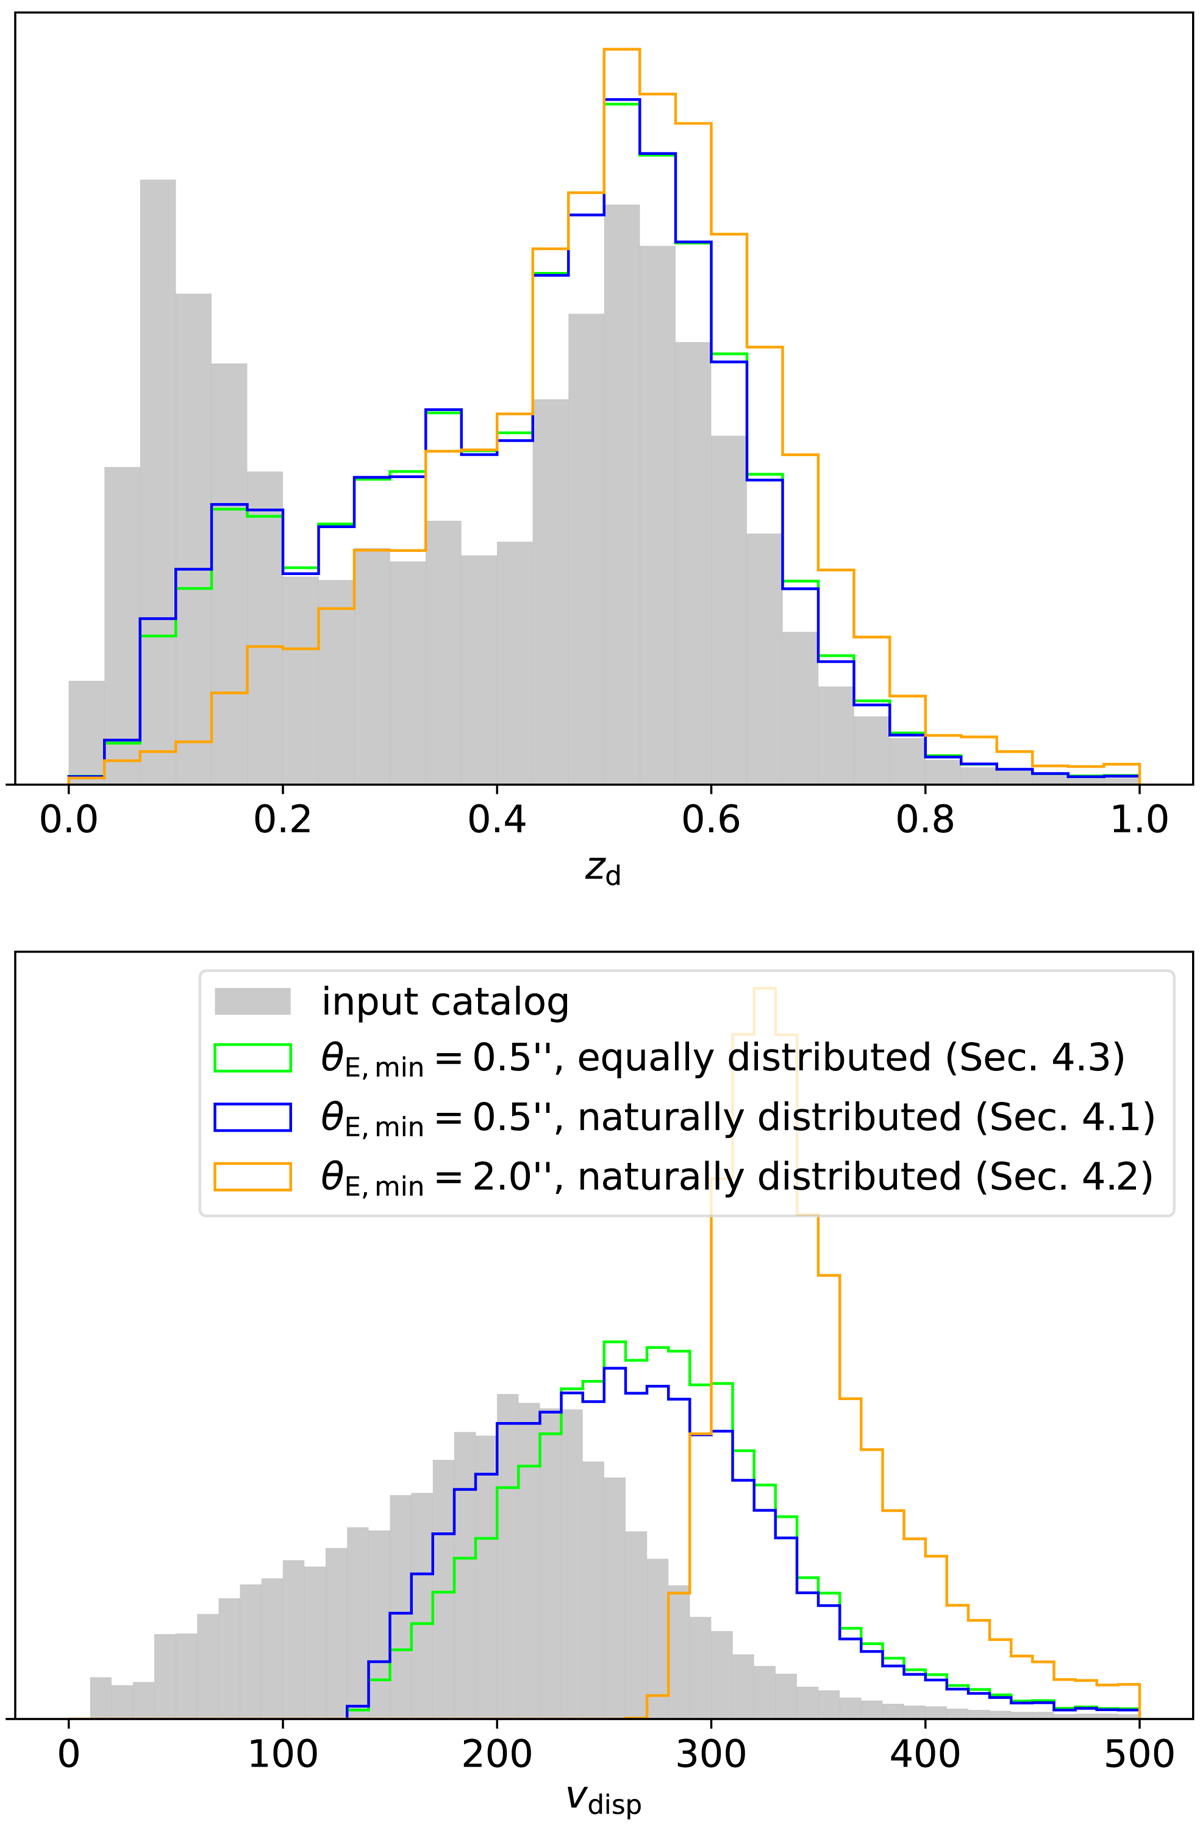
Distributions of the lens galaxy redshifts zd (top) and velocity dispersion vdisp (bottom). Shown are the distributions of the input catalogs to the simulation code (in gray), and the distributions of the generated samples discussed in Sect. 4 (see inset for color-coding).
Current usage metrics show cumulative count of Article Views (full-text article views including HTML views, PDF and ePub downloads, according to the available data) and Abstracts Views on Vision4Press platform.
Data correspond to usage on the plateform after 2015. The current usage metrics is available 48-96 hours after online publication and is updated daily on week days.
Initial download of the metrics may take a while.