Fig. 8
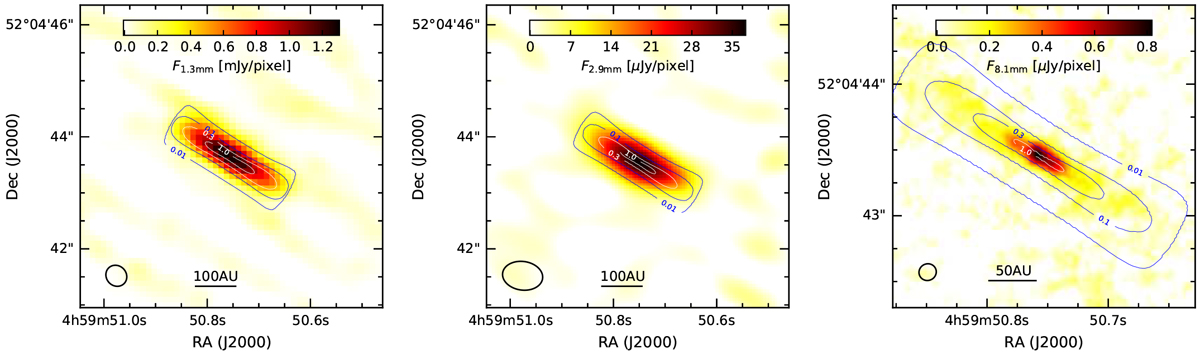
Modelled optical depth contours (τ1.3mm, τ2.9mm, τ8.1mm), overlaid on the observed intensity maps at 1.3, 2.9, and 8.1 mm, respectively. The observed intensity maps are identical to those shown in the leftmost panels of Fig. 3, and show the dust emission convolved with the indicated beam sizes, while the optical depth contours are not convolved. The optical depth value is indicated at each corresponding contour. The zoomed-in optical depth distributions are displayed in Fig. 9.
Current usage metrics show cumulative count of Article Views (full-text article views including HTML views, PDF and ePub downloads, according to the available data) and Abstracts Views on Vision4Press platform.
Data correspond to usage on the plateform after 2015. The current usage metrics is available 48-96 hours after online publication and is updated daily on week days.
Initial download of the metrics may take a while.