Fig. 4
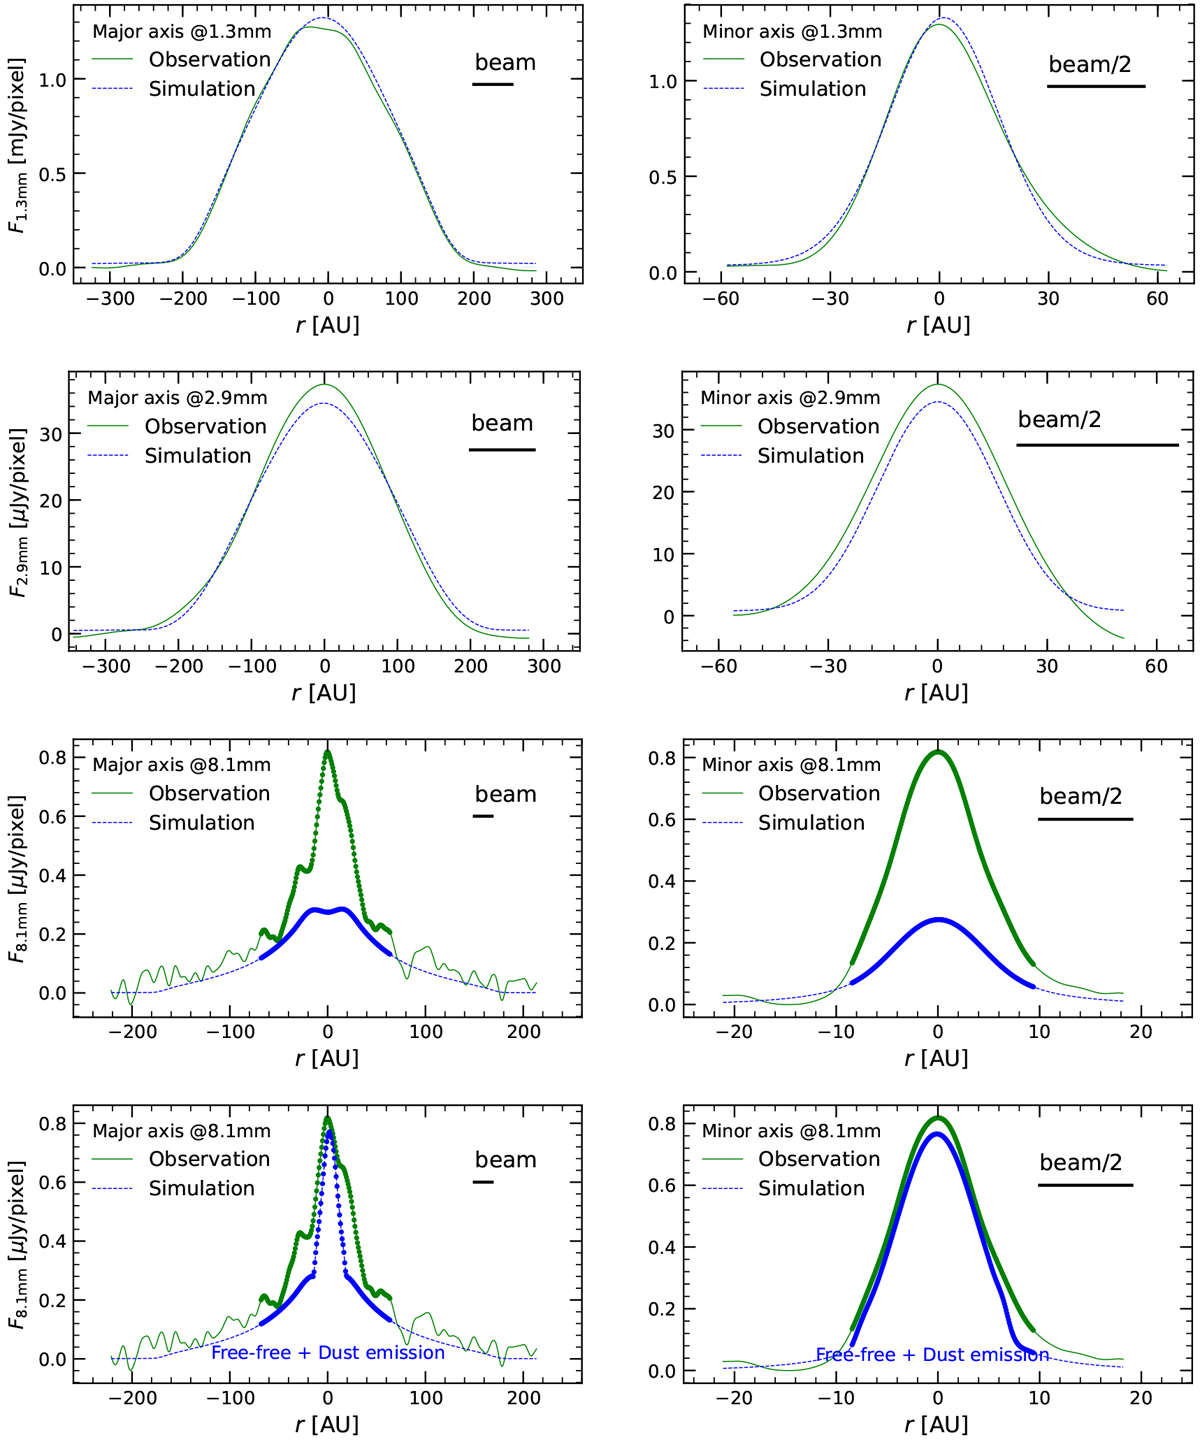
Intensity distribution cuts along the major and minor axes (see Fig. 3) in observations and simulations at 1.3, 2.9, and 8.1 mm. The pixel size at each wavelength is listed in the caption of Fig. 3. The central peak at 8.1 mm was masked for fitting (marked with thick line, see details in Sect. 3.7 and Fig. 3). Lowest panel: 8.1 mm free-free emission is included by assuming a point source with flux ~77 μJy (see Sect. 5.1).
Current usage metrics show cumulative count of Article Views (full-text article views including HTML views, PDF and ePub downloads, according to the available data) and Abstracts Views on Vision4Press platform.
Data correspond to usage on the plateform after 2015. The current usage metrics is available 48-96 hours after online publication and is updated daily on week days.
Initial download of the metrics may take a while.