Fig. A.1
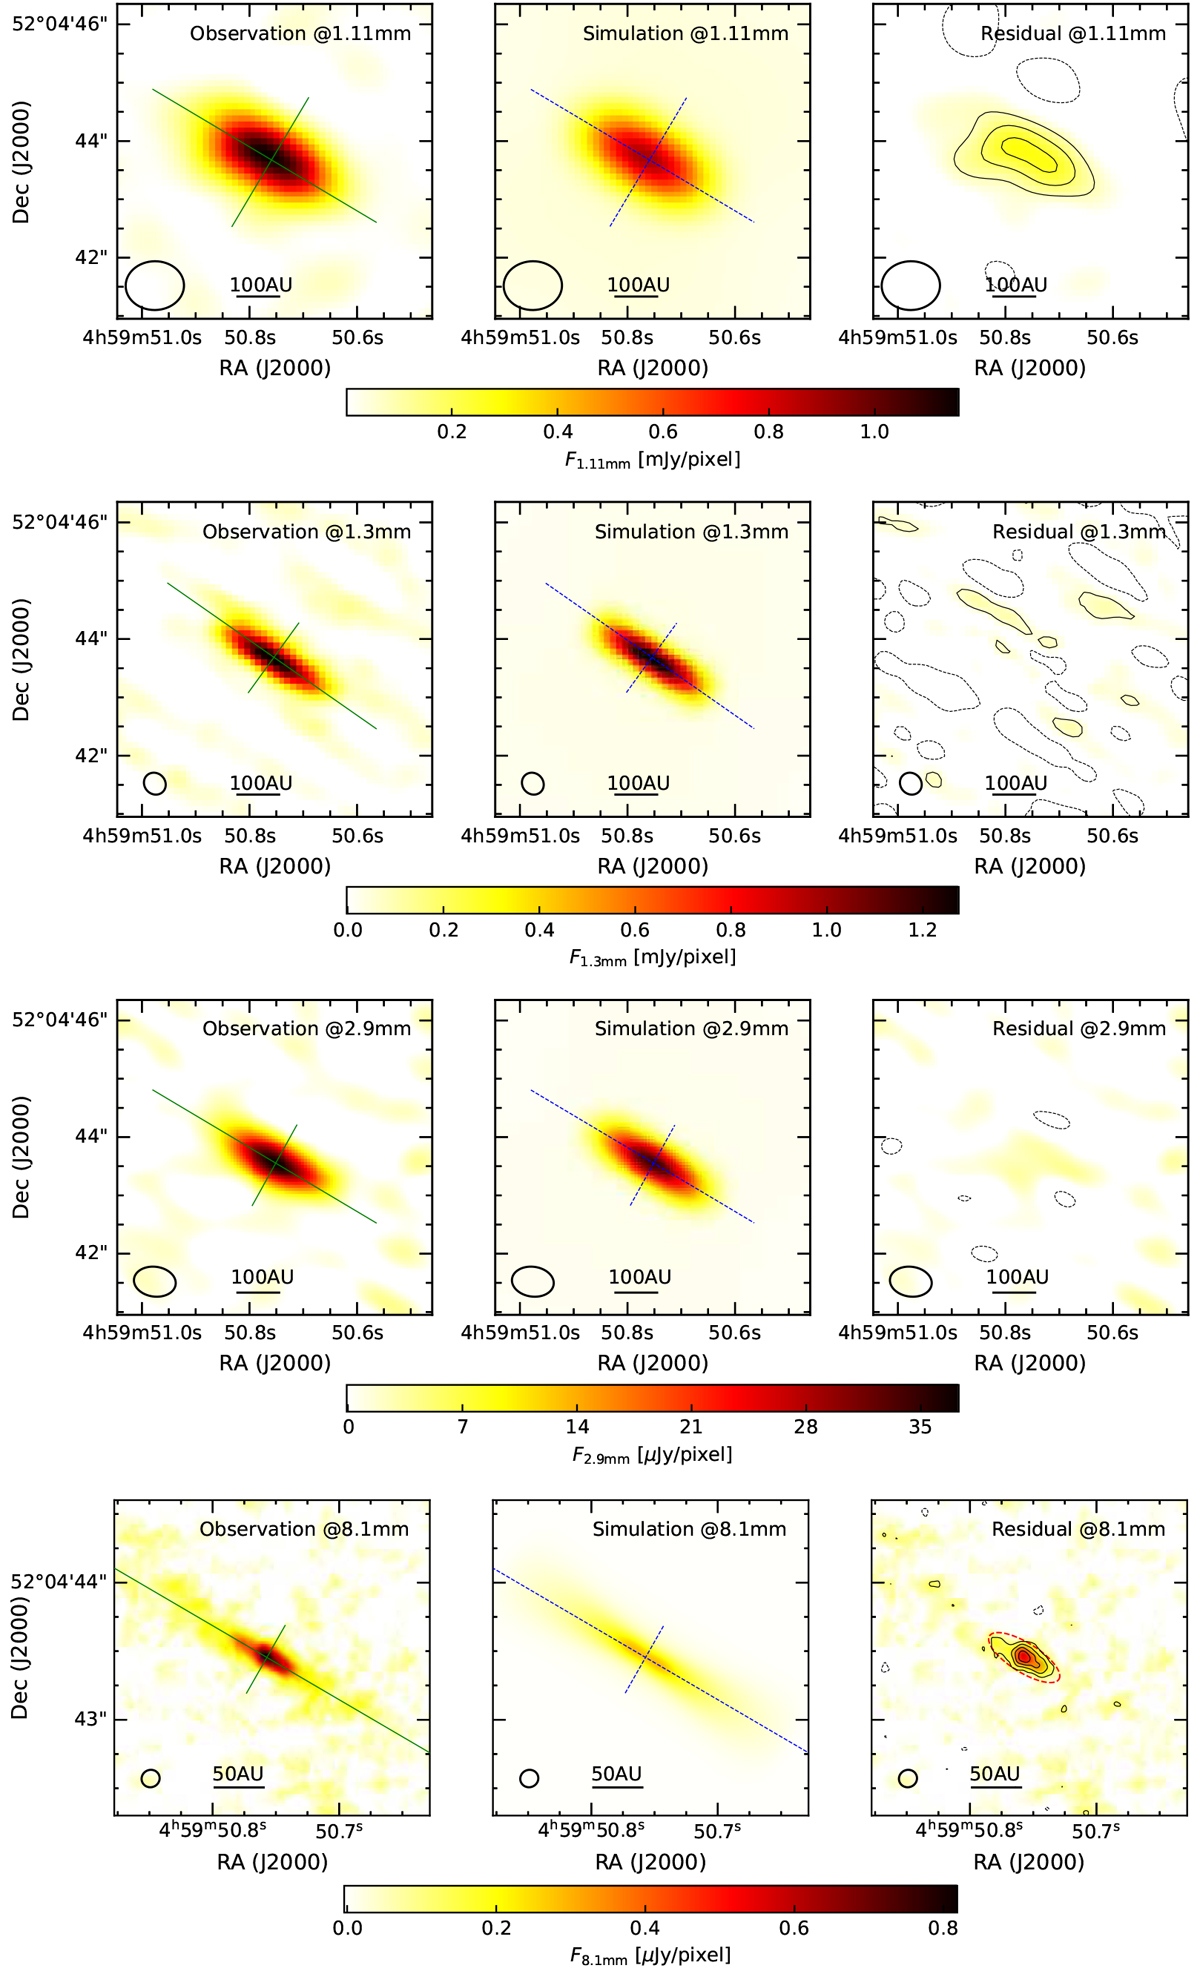
Observed and modeled intensity maps at 1.1, 1.3, 2.9, and 8.1 mm. The modeled maps have smaller pixel sizes than the observed maps, but are convolved to the same beam sizes as the respective observations (shown as ellipses in the lower left corners). The contour levels in each residual image start at −3σ, 3σ in steps of 3σ with σ1.1mm = 0.028 mJy pixel−1 (1 pixel = 0.1″ × 0.1″ at 1.1 mm), σ1.3mm = 0.019 mJy pixel−1 (1 pixel = 0.1″ × 0.1″ at 1.3 mm), σ2.9mm = 1.37 μJy pixel−1 (1 pixel = 0.05″ × 0.05″ at 2.9 mm), and σ8.1mm = 0.038 μJy pixel−1 (1 pixel = 0.01″ × 0.01″ at 8.1 mm) in the observations. Solid green and dotted blue lines show the directions of major and minor axes in the observation and simulation panels (cf. Fig. A.2). The central compact emission within the red-dashed ellipse at 8.1mm residual map was masked for fitting (see details in Sect. 3.7).
Current usage metrics show cumulative count of Article Views (full-text article views including HTML views, PDF and ePub downloads, according to the available data) and Abstracts Views on Vision4Press platform.
Data correspond to usage on the plateform after 2015. The current usage metrics is available 48-96 hours after online publication and is updated daily on week days.
Initial download of the metrics may take a while.