Fig. 9.
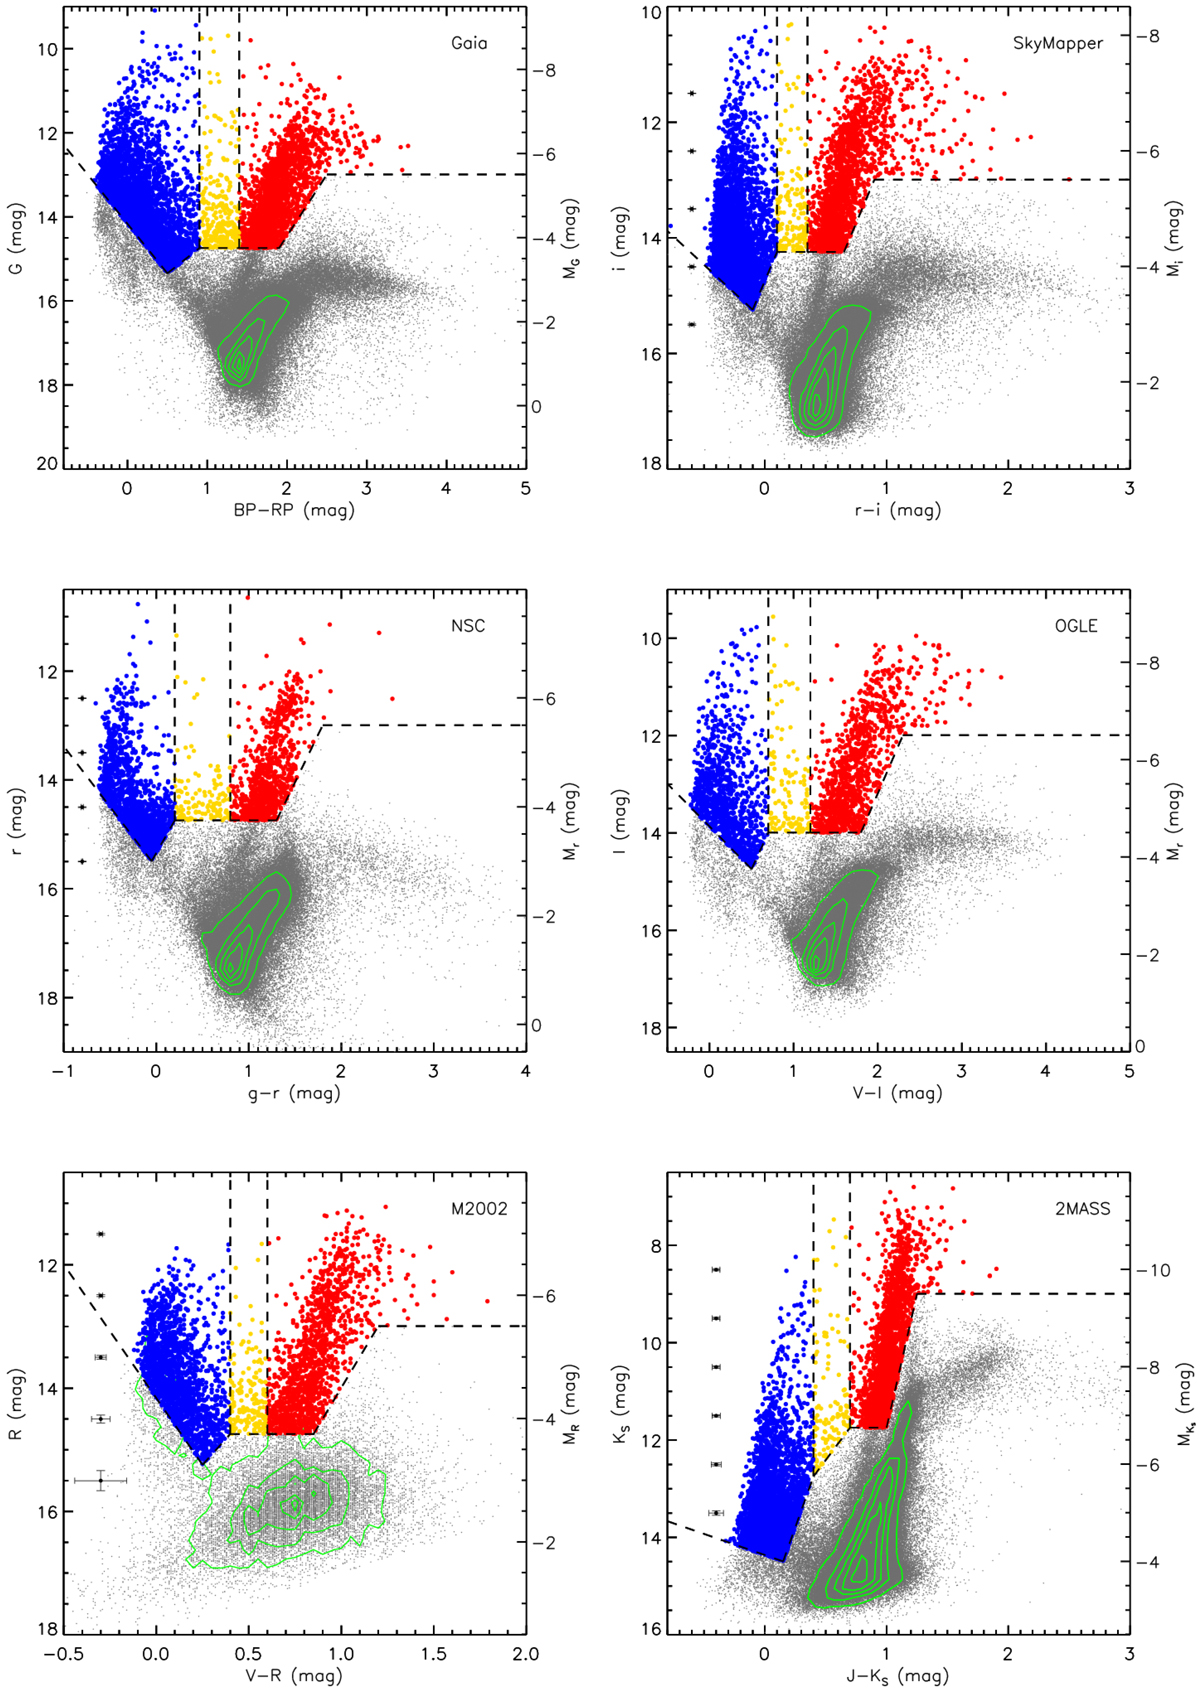
Color-magnitude diagrams of Gaia (upper left), SkyMapper (upper right), NSC (middle left), OGLE (middle right), M2002 (bottom left), and 2MASS (bottom right) datasets. In each diagram, different regions of BSGs (blue), YSGs (yellow), and RSGs (red) are indicated by the dashed lines. The average photometric uncertainties are indicated when available. The diagrams show a clear bimodal distribution of the BSG and RSG candidates with few YSG candidates lying between them.
Current usage metrics show cumulative count of Article Views (full-text article views including HTML views, PDF and ePub downloads, according to the available data) and Abstracts Views on Vision4Press platform.
Data correspond to usage on the plateform after 2015. The current usage metrics is available 48-96 hours after online publication and is updated daily on week days.
Initial download of the metrics may take a while.