Fig. 8.
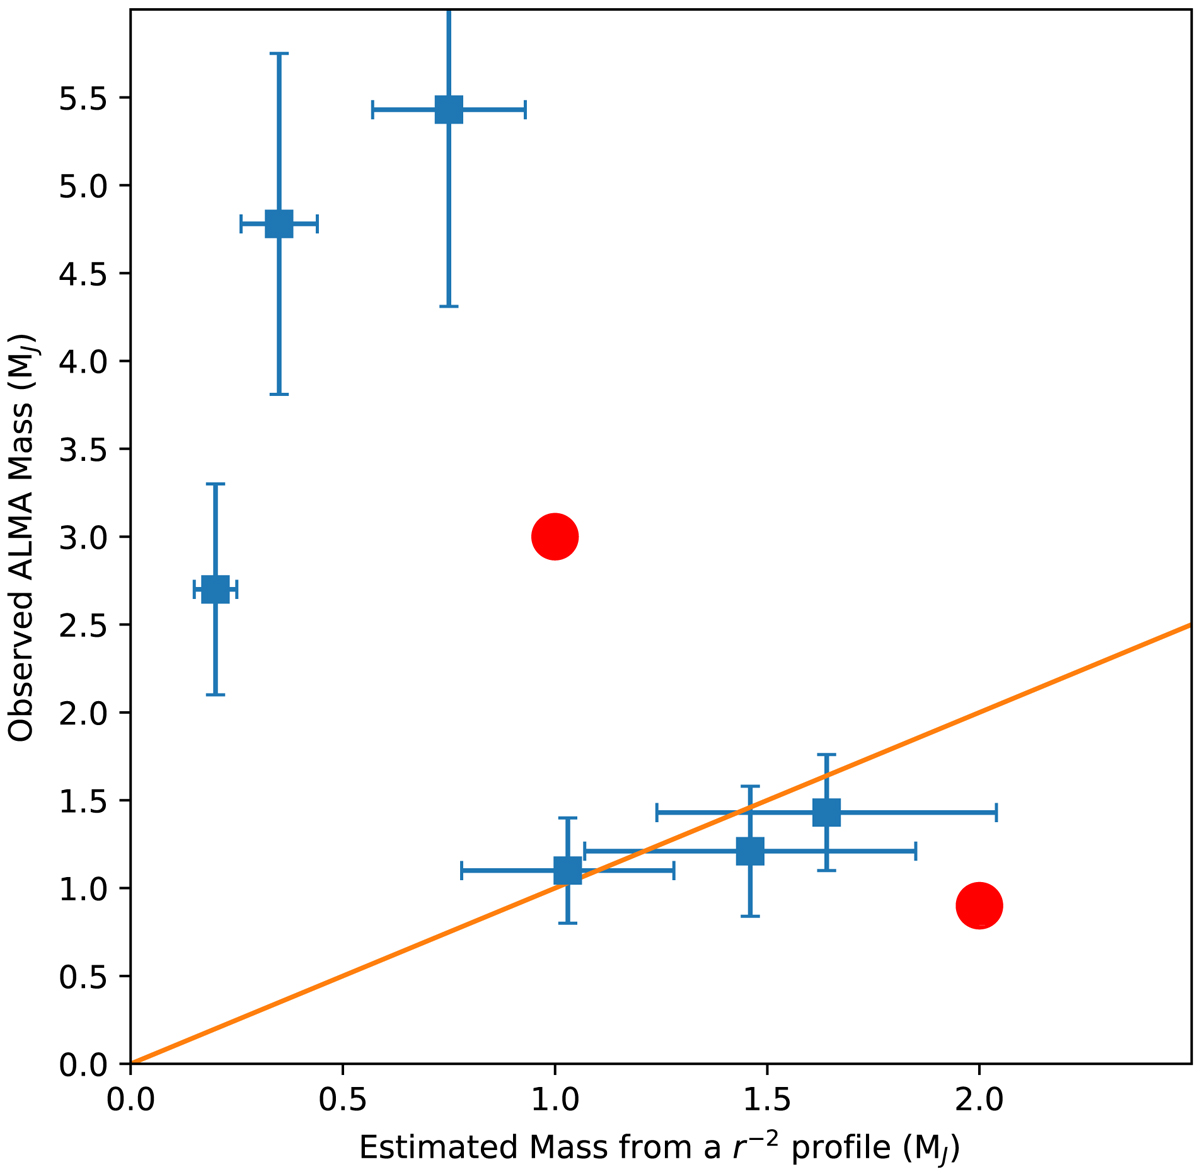
Observed mass for the pre-BD vs. the estimated mass using a r−2 density profile. Using that profile and the flux detected with AzTEC we estimate the expected mass inside the ALMA beam. Blue squares are sources in this work detected with ALMA. Red points are sources from Huélamo et al. (2017). The ratio between the observed and the estimated masses is close to ∼1 (orange line) for half of the sources (see Sect. 4.4.2). The other three sources with steeper density profiles might be more evolved as they have accreted more mass onto the central object.
Current usage metrics show cumulative count of Article Views (full-text article views including HTML views, PDF and ePub downloads, according to the available data) and Abstracts Views on Vision4Press platform.
Data correspond to usage on the plateform after 2015. The current usage metrics is available 48-96 hours after online publication and is updated daily on week days.
Initial download of the metrics may take a while.