Fig. 7.
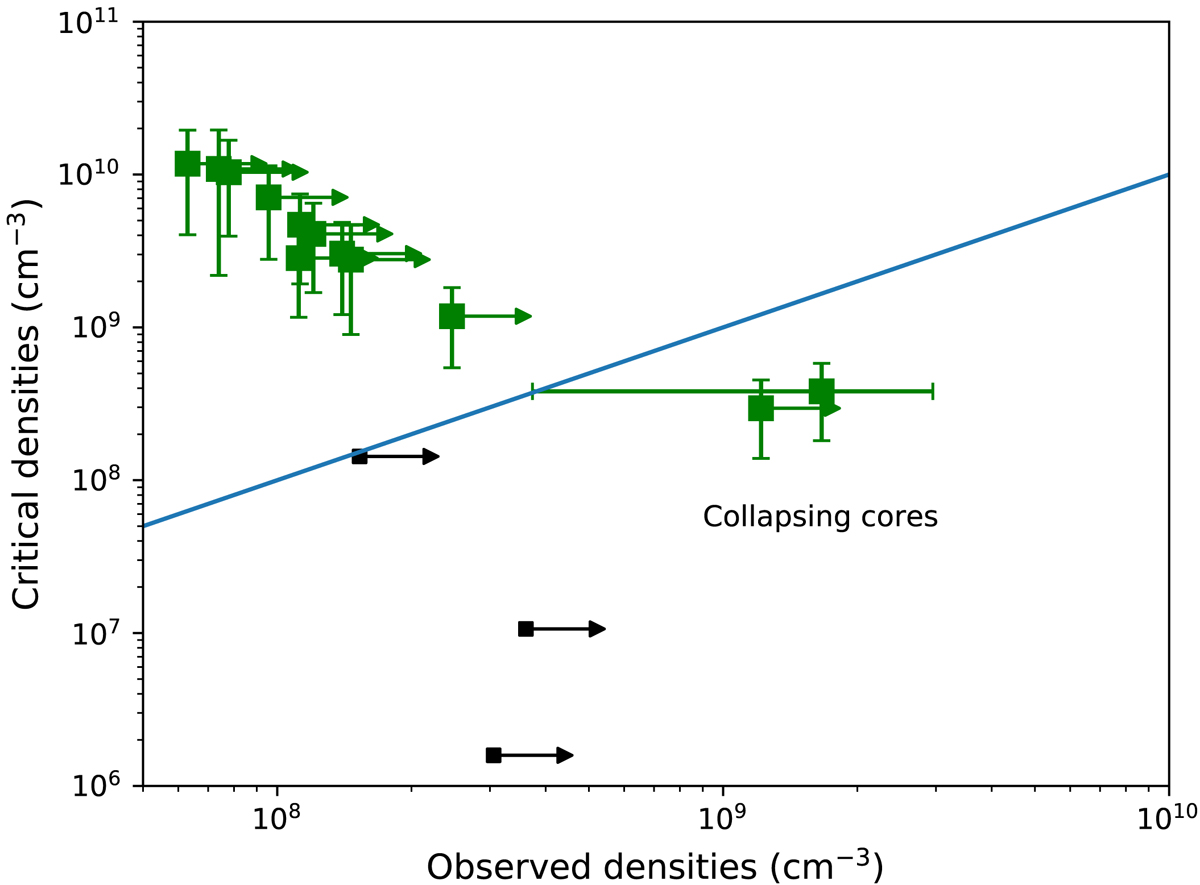
Critical densities vs observed densities at an adopted temperature T = 9 K using ALMA. Green symbols shows the sources studied in this work and the square is J154456. Black symbols shows the sources in Huélamo et al. (2017). Lower limits are included as arrows. Below the blue line the cores should be unstable, and therefore collapsing.
Current usage metrics show cumulative count of Article Views (full-text article views including HTML views, PDF and ePub downloads, according to the available data) and Abstracts Views on Vision4Press platform.
Data correspond to usage on the plateform after 2015. The current usage metrics is available 48-96 hours after online publication and is updated daily on week days.
Initial download of the metrics may take a while.