Fig. 5.
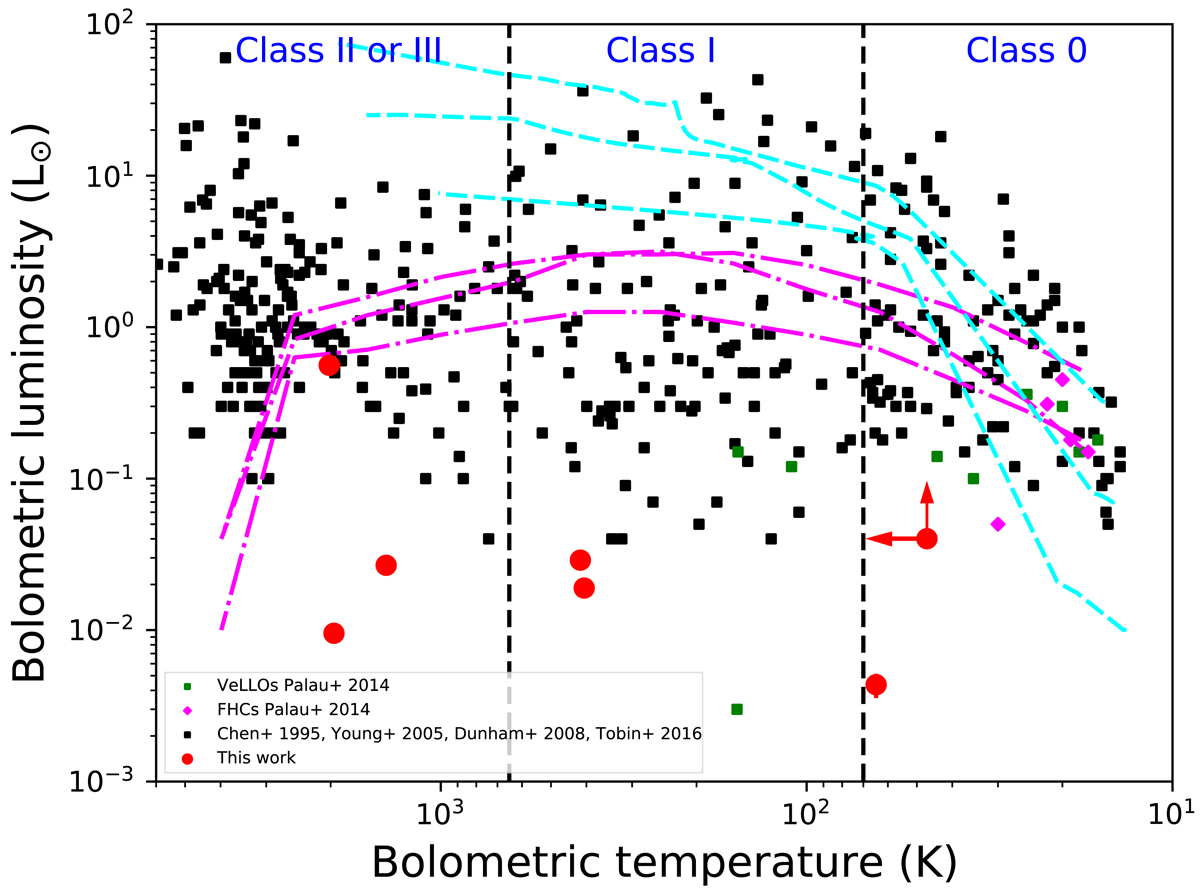
Bolometric luminosity versus bolometric temperature. Black squares represent sources from Young & Evans (2005) and Dunham et al. (2008) which show evidence of embedded low luminosity sources. Sources in Perseus from Tobin et al. (2016) are represented as open squares. Young Taurus (Chen et al. 1995) sources are displayed as black crosses. Green squares are known VeLLOs and the magenta diamonds are the First Hydrostatic Cores from Palau et al. (2014). The vertical dashed lines mark the Class 0–I and Class I–II bolometric temperature boundaries from Chen et al. (1995). The cyan short-dashed lines represent the evolutionary tracks for the three models with different masses considered by Young & Evans (2005). The magenta, dotted, and dot-dashed lines show the evolutionary tracks for three models considered by Myers et al. (1998). Red points including uncertainty represent values obtained in this papers. Lower limits are included as red arrows shows for J153914.
Current usage metrics show cumulative count of Article Views (full-text article views including HTML views, PDF and ePub downloads, according to the available data) and Abstracts Views on Vision4Press platform.
Data correspond to usage on the plateform after 2015. The current usage metrics is available 48-96 hours after online publication and is updated daily on week days.
Initial download of the metrics may take a while.