Free Access
Fig. B.4.
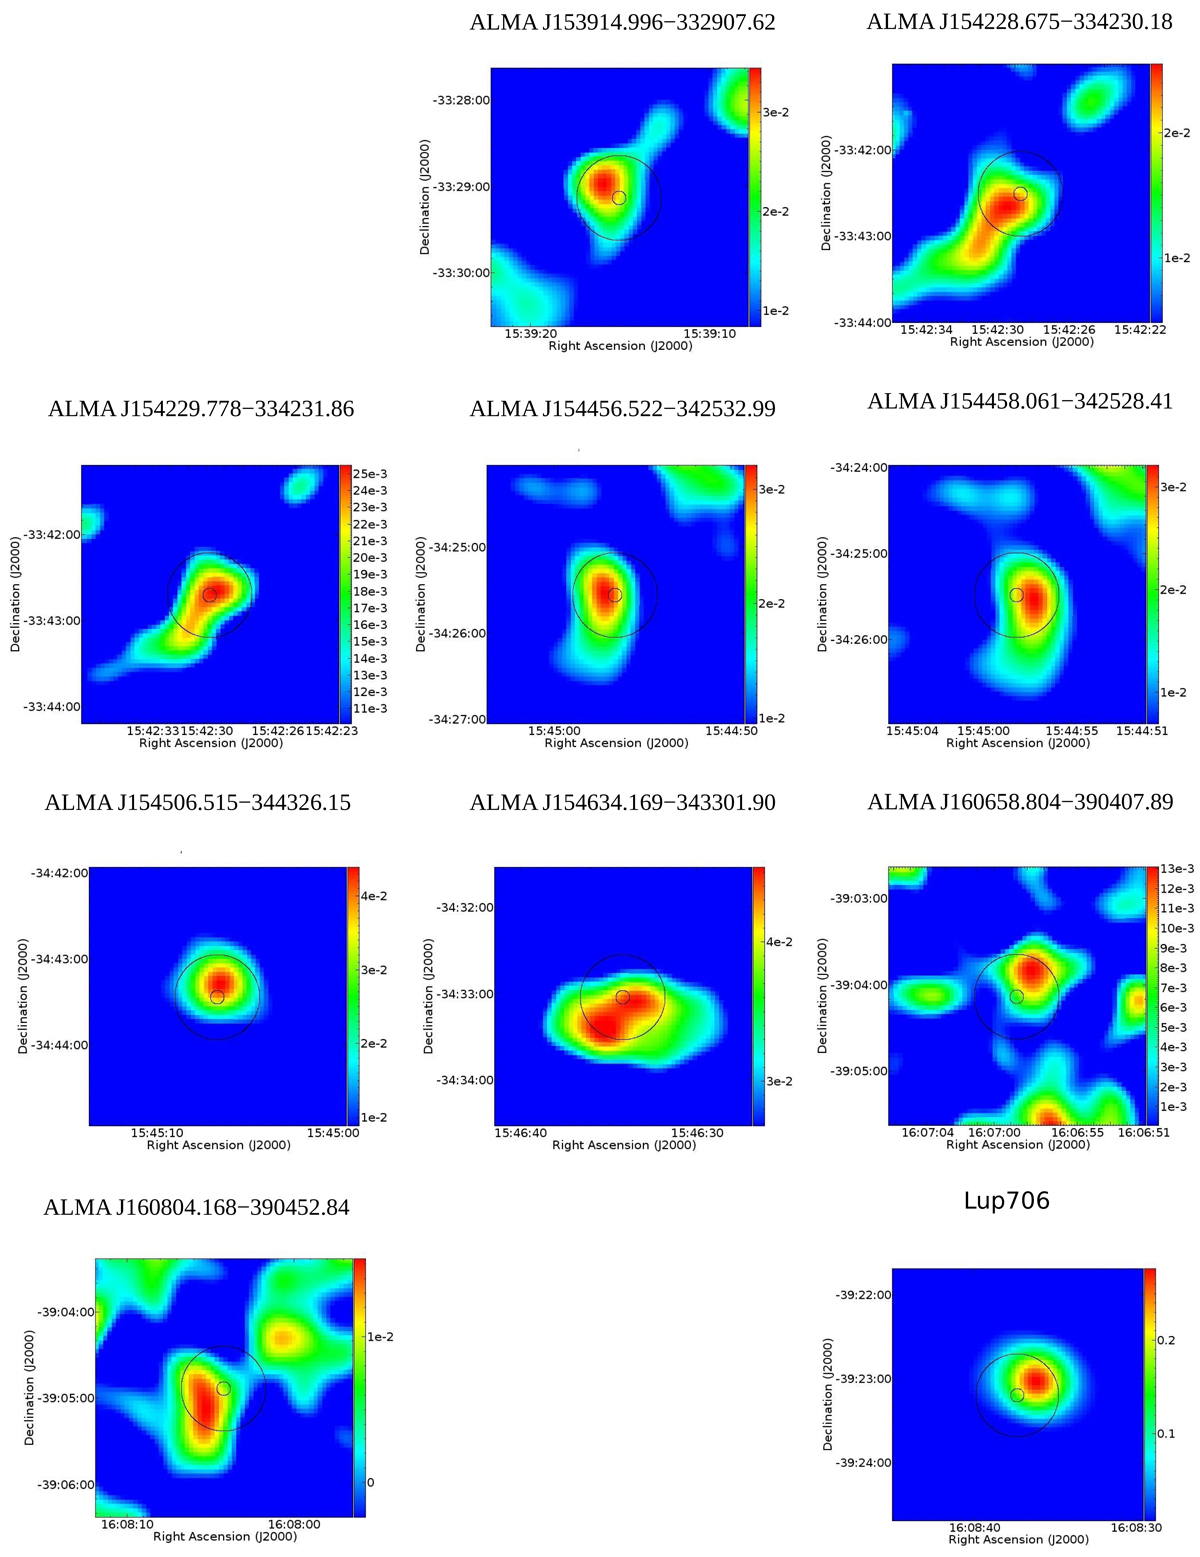
AzTEC maps centred at the position of the ALMA detections. The position is in RA and Dec (J2000). The wedge colour bar at the right shows the intensity (mJy beam−1). The smaller circle is 5″ in diameter and the greater one 30″. SONYC-Lup3-7 and 161030.6−383151 have no images.
Current usage metrics show cumulative count of Article Views (full-text article views including HTML views, PDF and ePub downloads, according to the available data) and Abstracts Views on Vision4Press platform.
Data correspond to usage on the plateform after 2015. The current usage metrics is available 48-96 hours after online publication and is updated daily on week days.
Initial download of the metrics may take a while.