Fig. 8.
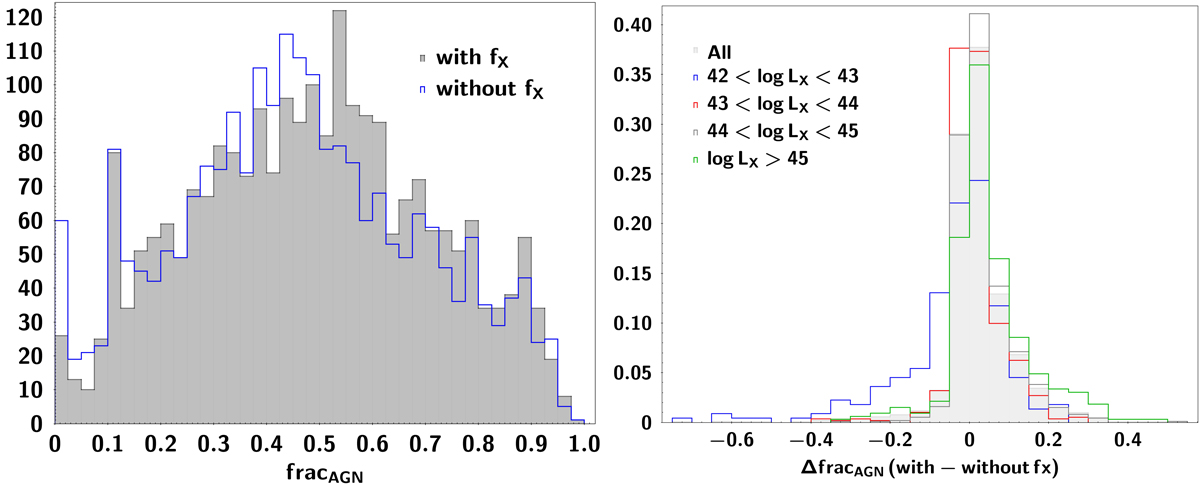
Left: distribution of the AGN fraction, with X-ray flux (black shaded area) and without X-ray flux (blue histogram). Right: distribution of the difference of the AGN fraction, with and without X-ray flux, for different luminosity bins. All distributions are normalised to unity. A tail appears at positive values, i.e., the AGN fractions are higher when X-ray flux is included in the SED fitting, for AGNs with LX < 1043 erg s−1 that becomes more prominent for the most luminous sources (LX < 1045 erg s−1). On the other hand, there is a tail at negative values, i.e. the AGN fractions are lower with X-ray flux, for the fainter AGNs (LX < 1043 erg s−1, blue line).
Current usage metrics show cumulative count of Article Views (full-text article views including HTML views, PDF and ePub downloads, according to the available data) and Abstracts Views on Vision4Press platform.
Data correspond to usage on the plateform after 2015. The current usage metrics is available 48-96 hours after online publication and is updated daily on week days.
Initial download of the metrics may take a while.